

9 Si Nanopowder for Photoluminescence and Hydrogen Generation Materials
379
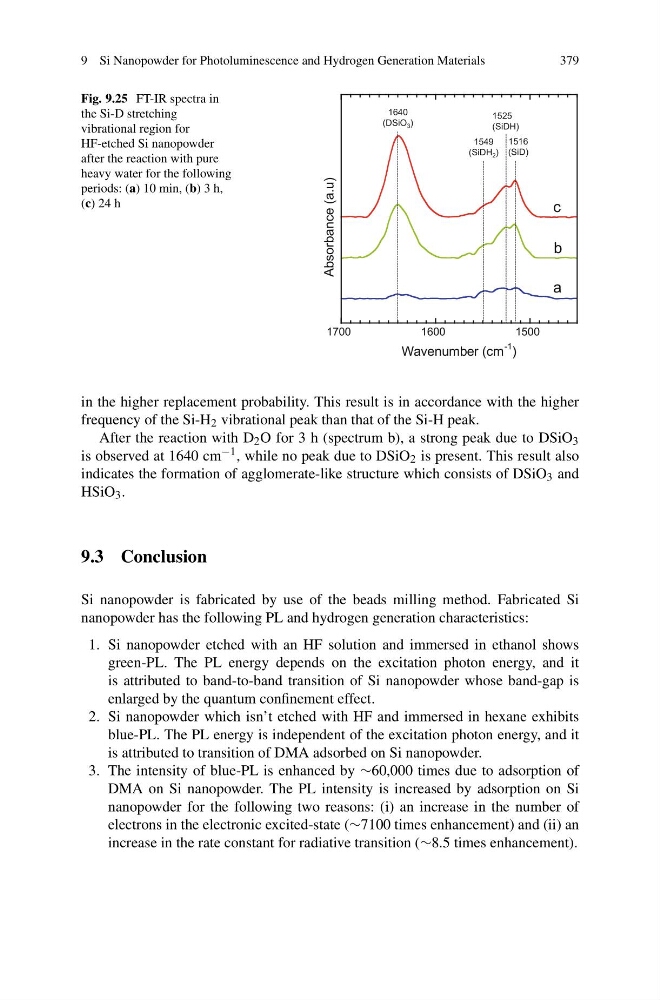
Fig. 9.25 FT-IR spectra in
the Si-D stretching
vibrational region for
HF-etched Si nanopowder
after the reaction with pure
heavy water for the following
periods: (a) 10 min, (b) 3 h,
(c) 24 h
1500
1600
1700
Absorbance (a.u)
Wavenumber (cm
-1 )
a
b
c
1516
(SiD)
1525
(SiDH)
1549
(SiDH 2 )
1640
(DSiO 3 )
in the higher replacement probability. This result is in accordance with the higher
frequency of the Si-H 2 vibrational peak than that of the Si-H peak.
After the reaction with D 2 O for 3 h (spectrum b), a strong peak due to DSiO 3
is observed at 1640 cm −1 , while no peak due to DSiO 2 is present. This result also
indicates the formation of agglomerate-like structure which consists of DSiO 3 and
HSiO 3 .
9.3 Conclusion
Si nanopowder is fabricated by use of the beads milling method. Fabricated Si
nanopowder has the following PL and hydrogen generation characteristics:
1. Si nanopowder etched with an HF solution and immersed in ethanol shows
green-PL. The PL energy depends on the excitation photon energy, and it
is attributed to band-to-band transition of Si nanopowder whose band-gap is
enlarged by the quantum confinement effect.
2. Si nanopowder which isn’t etched with HF and immersed in hexane exhibits
blue-PL. The PL energy is independent of the excitation photon energy, and it
is attributed to transition of DMA adsorbed on Si nanopowder.
3. The intensity of blue-PL is enhanced by ∼60,000 times due to adsorption of
DMA on Si nanopowder. The PL intensity is increased by adsorption on Si
nanopowder for the following two reasons: (i) an increase in the number of
electrons in the electronic excited-state (∼7100 times enhancement) and (ii) an
increase in the rate constant for radiative transition (∼8.5 times enhancement).
379
Fig. 9.25 FT-IR spectra in
the Si-D stretching
vibrational region for
HF-etched Si nanopowder
after the reaction with pure
heavy water for the following
periods: (a) 10 min, (b) 3 h,
(c) 24 h
1500
1600
1700
Absorbance (a.u)
Wavenumber (cm
-1 )
a
b
c
1516
(SiD)
1525
(SiDH)
1549
(SiDH 2 )
1640
(DSiO 3 )
in the higher replacement probability. This result is in accordance with the higher
frequency of the Si-H 2 vibrational peak than that of the Si-H peak.
After the reaction with D 2 O for 3 h (spectrum b), a strong peak due to DSiO 3
is observed at 1640 cm −1 , while no peak due to DSiO 2 is present. This result also
indicates the formation of agglomerate-like structure which consists of DSiO 3 and
HSiO 3 .
9.3 Conclusion
Si nanopowder is fabricated by use of the beads milling method. Fabricated Si
nanopowder has the following PL and hydrogen generation characteristics:
1. Si nanopowder etched with an HF solution and immersed in ethanol shows
green-PL. The PL energy depends on the excitation photon energy, and it
is attributed to band-to-band transition of Si nanopowder whose band-gap is
enlarged by the quantum confinement effect.
2. Si nanopowder which isn’t etched with HF and immersed in hexane exhibits
blue-PL. The PL energy is independent of the excitation photon energy, and it
is attributed to transition of DMA adsorbed on Si nanopowder.
3. The intensity of blue-PL is enhanced by ∼60,000 times due to adsorption of
DMA on Si nanopowder. The PL intensity is increased by adsorption on Si
nanopowder for the following two reasons: (i) an increase in the number of
electrons in the electronic excited-state (∼7100 times enhancement) and (ii) an
increase in the rate constant for radiative transition (∼8.5 times enhancement).