

376
Y. Kobayashi and H. Kobayashi
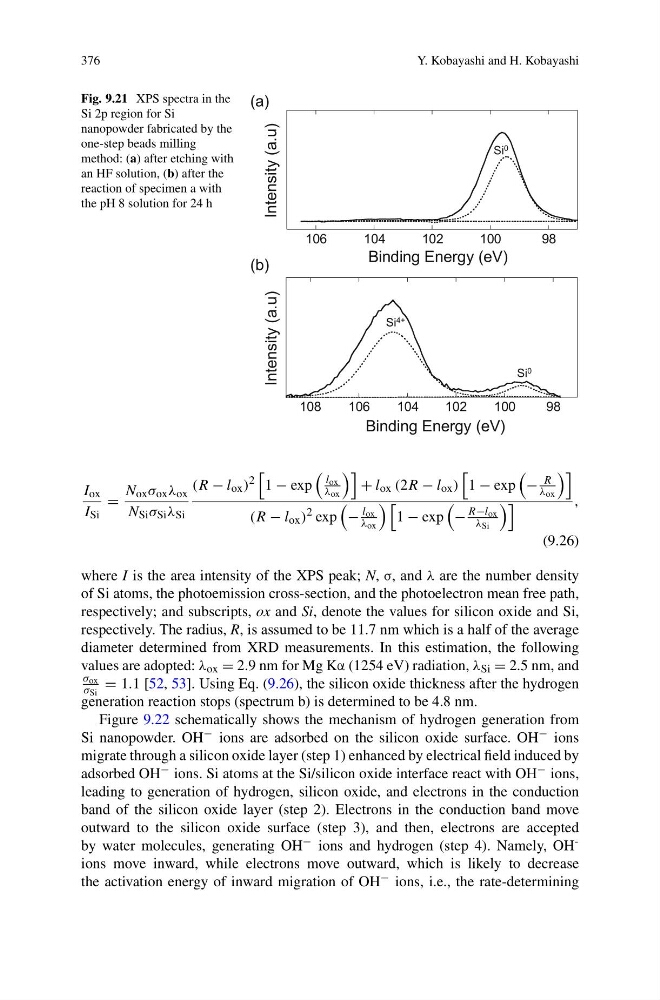
Fig. 9.21 XPS spectra in the
Si 2p region for Si
nanopowder fabricated by the
one-step beads milling
method: (a) after etching with
an HF solution, (b) after the
reaction of specimen a with
the pH 8 solution for 24 h
(a)
Si 0
98
100
102
104
106
Intensity (a.u)
Binding Energy (eV)
98
100
102
104
106
108
Intensity (a.u)
Binding Energy (eV)
Si 0
Si 4+
(b)
I ox
I Si
=
N ox σ ox λ ox
N Si σ Si λ Si
(R − l ox )
2
1 − exp
l ox
λ ox
+ l ox (2R − l ox )
1 − exp
−
R
λ ox
(R − l ox )
2 exp
−
l ox
λ ox
1 − exp
−
R−l ox
λ Si
,
(9.26)
where I is the area intensity of the XPS peak; N, σ, and λ are the number density
of Si atoms, the photoemission cross-section, and the photoelectron mean free path,
respectively; and subscripts, ox and Si, denote the values for silicon oxide and Si,
respectively. The radius, R, is assumed to be 11.7 nm which is a half of the average
diameter determined from XRD measurements. In this estimation, the following
values are adopted: λ ox = 2.9 nm for Mg Kα (1254 eV) radiation, λ Si = 2.5 nm, and
σ ox
σ Si
= 1.1 [52, 53]. Using Eq. (9.26), the silicon oxide thickness after the hydrogen
generation reaction stops (spectrum b) is determined to be 4.8 nm.
Figure 9.22 schematically shows the mechanism of hydrogen generation from
Si nanopowder. OH − ions are adsorbed on the silicon oxide surface. OH − ions
migrate through a silicon oxide layer (step 1) enhanced by electrical field induced by
adsorbed OH − ions. Si atoms at the Si/silicon oxide interface react with OH − ions,
leading to generation of hydrogen, silicon oxide, and electrons in the conduction
band of the silicon oxide layer (step 2). Electrons in the conduction band move
outward to the silicon oxide surface (step 3), and then, electrons are accepted
by water molecules, generating OH − ions and hydrogen (step 4). Namely, OH -
ions move inward, while electrons move outward, which is likely to decrease
the activation energy of inward migration of OH − ions, i.e., the rate-determining
Y. Kobayashi and H. Kobayashi
Fig. 9.21 XPS spectra in the
Si 2p region for Si
nanopowder fabricated by the
one-step beads milling
method: (a) after etching with
an HF solution, (b) after the
reaction of specimen a with
the pH 8 solution for 24 h
(a)
Si 0
98
100
102
104
106
Intensity (a.u)
Binding Energy (eV)
98
100
102
104
106
108
Intensity (a.u)
Binding Energy (eV)
Si 0
Si 4+
(b)
I ox
I Si
=
N ox σ ox λ ox
N Si σ Si λ Si
(R − l ox )
2
1 − exp
l ox
λ ox
+ l ox (2R − l ox )
1 − exp
−
R
λ ox
(R − l ox )
2 exp
−
l ox
λ ox
1 − exp
−
R−l ox
λ Si
,
(9.26)
where I is the area intensity of the XPS peak; N, σ, and λ are the number density
of Si atoms, the photoemission cross-section, and the photoelectron mean free path,
respectively; and subscripts, ox and Si, denote the values for silicon oxide and Si,
respectively. The radius, R, is assumed to be 11.7 nm which is a half of the average
diameter determined from XRD measurements. In this estimation, the following
values are adopted: λ ox = 2.9 nm for Mg Kα (1254 eV) radiation, λ Si = 2.5 nm, and
σ ox
σ Si
= 1.1 [52, 53]. Using Eq. (9.26), the silicon oxide thickness after the hydrogen
generation reaction stops (spectrum b) is determined to be 4.8 nm.
Figure 9.22 schematically shows the mechanism of hydrogen generation from
Si nanopowder. OH − ions are adsorbed on the silicon oxide surface. OH − ions
migrate through a silicon oxide layer (step 1) enhanced by electrical field induced by
adsorbed OH − ions. Si atoms at the Si/silicon oxide interface react with OH − ions,
leading to generation of hydrogen, silicon oxide, and electrons in the conduction
band of the silicon oxide layer (step 2). Electrons in the conduction band move
outward to the silicon oxide surface (step 3), and then, electrons are accepted
by water molecules, generating OH − ions and hydrogen (step 4). Namely, OH -
ions move inward, while electrons move outward, which is likely to decrease
the activation energy of inward migration of OH − ions, i.e., the rate-determining