

9 Si Nanopowder for Photoluminescence and Hydrogen Generation Materials
375
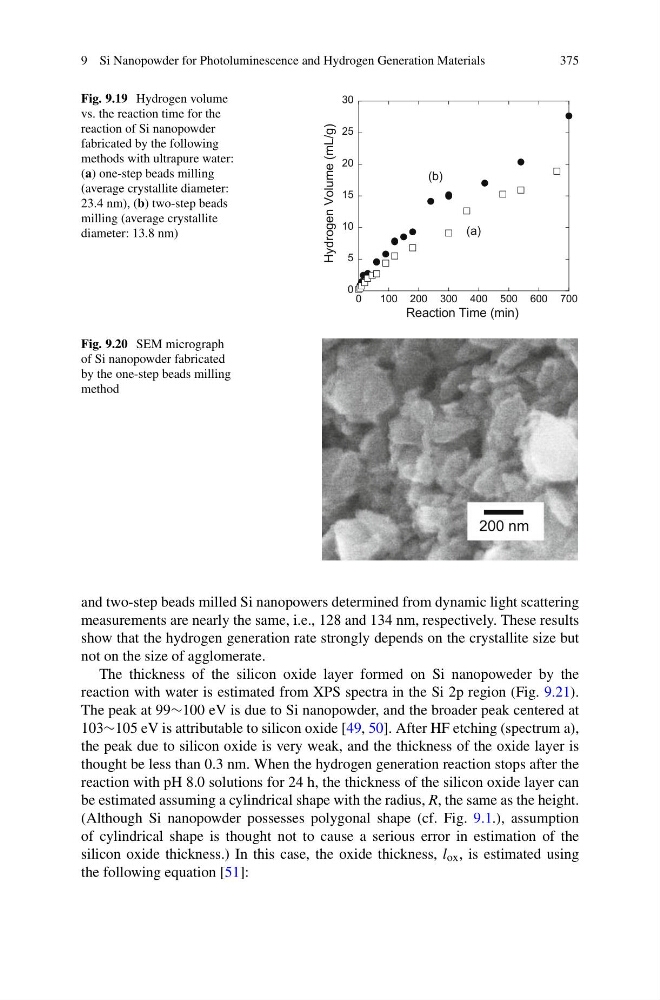
Fig. 9.19 Hydrogen volume
vs. the reaction time for the
reaction of Si nanopowder
fabricated by the following
methods with ultrapure water:
(a) one-step beads milling
(average crystallite diameter:
23.4 nm), (b) two-step beads
milling (average crystallite
diameter: 13.8 nm)
0
5
10
15
20
25
30
0
100 200 300 400 500 600 700
Reaction Time (min)
Hydrogen Volume (mL/g)
(a)
(b)
Fig. 9.20 SEM micrograph
of Si nanopowder fabricated
by the one-step beads milling
method
200 nm
and two-step beads milled Si nanopowers determined from dynamic light scattering
measurements are nearly the same, i.e., 128 and 134 nm, respectively. These results
show that the hydrogen generation rate strongly depends on the crystallite size but
not on the size of agglomerate.
The thickness of the silicon oxide layer formed on Si nanopoweder by the
reaction with water is estimated from XPS spectra in the Si 2p region (Fig. 9.21).
The peak at 99∼100 eV is due to Si nanopowder, and the broader peak centered at
103∼105 eV is attributable to silicon oxide [49, 50]. After HF etching (spectrum a),
the peak due to silicon oxide is very weak, and the thickness of the oxide layer is
thought be less than 0.3 nm. When the hydrogen generation reaction stops after the
reaction with pH 8.0 solutions for 24 h, the thickness of the silicon oxide layer can
be estimated assuming a cylindrical shape with the radius, R, the same as the height.
(Although Si nanopowder possesses polygonal shape (cf. Fig. 9.1.), assumption
of cylindrical shape is thought not to cause a serious error in estimation of the
silicon oxide thickness.) In this case, the oxide thickness, l ox , is estimated using
the following equation [51]:
375
Fig. 9.19 Hydrogen volume
vs. the reaction time for the
reaction of Si nanopowder
fabricated by the following
methods with ultrapure water:
(a) one-step beads milling
(average crystallite diameter:
23.4 nm), (b) two-step beads
milling (average crystallite
diameter: 13.8 nm)
0
5
10
15
20
25
30
0
100 200 300 400 500 600 700
Reaction Time (min)
Hydrogen Volume (mL/g)
(a)
(b)
Fig. 9.20 SEM micrograph
of Si nanopowder fabricated
by the one-step beads milling
method
200 nm
and two-step beads milled Si nanopowers determined from dynamic light scattering
measurements are nearly the same, i.e., 128 and 134 nm, respectively. These results
show that the hydrogen generation rate strongly depends on the crystallite size but
not on the size of agglomerate.
The thickness of the silicon oxide layer formed on Si nanopoweder by the
reaction with water is estimated from XPS spectra in the Si 2p region (Fig. 9.21).
The peak at 99∼100 eV is due to Si nanopowder, and the broader peak centered at
103∼105 eV is attributable to silicon oxide [49, 50]. After HF etching (spectrum a),
the peak due to silicon oxide is very weak, and the thickness of the oxide layer is
thought be less than 0.3 nm. When the hydrogen generation reaction stops after the
reaction with pH 8.0 solutions for 24 h, the thickness of the silicon oxide layer can
be estimated assuming a cylindrical shape with the radius, R, the same as the height.
(Although Si nanopowder possesses polygonal shape (cf. Fig. 9.1.), assumption
of cylindrical shape is thought not to cause a serious error in estimation of the
silicon oxide thickness.) In this case, the oxide thickness, l ox , is estimated using
the following equation [51]: