

374
Y. Kobayashi and H. Kobayashi
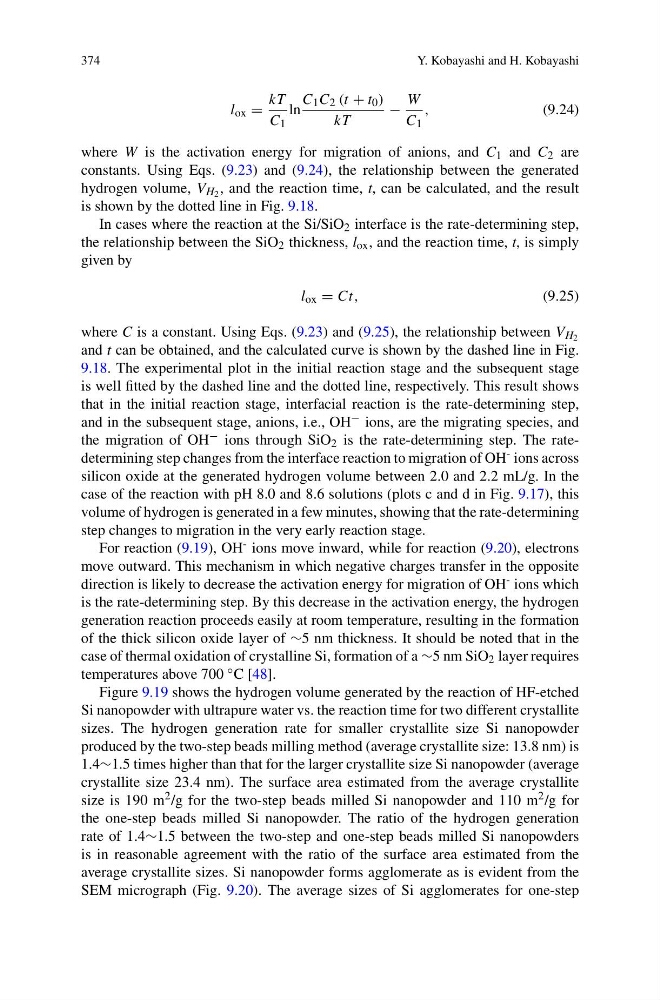
l ox =
kT
C 1
ln
C 1 C 2 (t + t 0 )
kT
−
W
C 1
,
(9.24)
where W is the activation energy for migration of anions, and C 1 and C 2 are
constants. Using Eqs. (9.23) and (9.24), the relationship between the generated
hydrogen volume, V H 2 , and the reaction time, t, can be calculated, and the result
is shown by the dotted line in Fig. 9.18.
In cases where the reaction at the Si/SiO 2 interface is the rate-determining step,
the relationship between the SiO 2 thickness, l ox , and the reaction time, t, is simply
given by
l ox = Ct,
(9.25)
where C is a constant. Using Eqs. (9.23) and (9.25), the relationship between V H 2
and t can be obtained, and the calculated curve is shown by the dashed line in Fig.
9.18. The experimental plot in the initial reaction stage and the subsequent stage
is well fitted by the dashed line and the dotted line, respectively. This result shows
that in the initial reaction stage, interfacial reaction is the rate-determining step,
and in the subsequent stage, anions, i.e., OH − ions, are the migrating species, and
the migration of OH − ions through SiO 2 is the rate-determining step. The ratedetermining step changes from the interface reaction to migration of OH - ions across
silicon oxide at the generated hydrogen volume between 2.0 and 2.2 mL/g. In the
case of the reaction with pH 8.0 and 8.6 solutions (plots c and d in Fig. 9.17), this
volume of hydrogen is generated in a few minutes, showing that the rate-determining
step changes to migration in the very early reaction stage.
For reaction (9.19), OH - ions move inward, while for reaction (9.20), electrons
move outward. This mechanism in which negative charges transfer in the opposite
direction is likely to decrease the activation energy for migration of OH - ions which
is the rate-determining step. By this decrease in the activation energy, the hydrogen
generation reaction proceeds easily at room temperature, resulting in the formation
of the thick silicon oxide layer of ∼5 nm thickness. It should be noted that in the
case of thermal oxidation of crystalline Si, formation of a ∼5 nm SiO 2 layer requires
temperatures above 700 ◦ C [48].
Figure 9.19 shows the hydrogen volume generated by the reaction of HF-etched
Si nanopowder with ultrapure water vs. the reaction time for two different crystallite
sizes. The hydrogen generation rate for smaller crystallite size Si nanopowder
produced by the two-step beads milling method (average crystallite size: 13.8 nm) is
1.4∼1.5 times higher than that for the larger crystallite size Si nanopowder (average
crystallite size 23.4 nm). The surface area estimated from the average crystallite
size is 190 m 2 /g for the two-step beads milled Si nanopowder and 110 m 2 /g for
the one-step beads milled Si nanopowder. The ratio of the hydrogen generation
rate of 1.4∼1.5 between the two-step and one-step beads milled Si nanopowders
is in reasonable agreement with the ratio of the surface area estimated from the
average crystallite sizes. Si nanopowder forms agglomerate as is evident from the
SEM micrograph (Fig. 9.20). The average sizes of Si agglomerates for one-step
Y. Kobayashi and H. Kobayashi
l ox =
kT
C 1
ln
C 1 C 2 (t + t 0 )
kT
−
W
C 1
,
(9.24)
where W is the activation energy for migration of anions, and C 1 and C 2 are
constants. Using Eqs. (9.23) and (9.24), the relationship between the generated
hydrogen volume, V H 2 , and the reaction time, t, can be calculated, and the result
is shown by the dotted line in Fig. 9.18.
In cases where the reaction at the Si/SiO 2 interface is the rate-determining step,
the relationship between the SiO 2 thickness, l ox , and the reaction time, t, is simply
given by
l ox = Ct,
(9.25)
where C is a constant. Using Eqs. (9.23) and (9.25), the relationship between V H 2
and t can be obtained, and the calculated curve is shown by the dashed line in Fig.
9.18. The experimental plot in the initial reaction stage and the subsequent stage
is well fitted by the dashed line and the dotted line, respectively. This result shows
that in the initial reaction stage, interfacial reaction is the rate-determining step,
and in the subsequent stage, anions, i.e., OH − ions, are the migrating species, and
the migration of OH − ions through SiO 2 is the rate-determining step. The ratedetermining step changes from the interface reaction to migration of OH - ions across
silicon oxide at the generated hydrogen volume between 2.0 and 2.2 mL/g. In the
case of the reaction with pH 8.0 and 8.6 solutions (plots c and d in Fig. 9.17), this
volume of hydrogen is generated in a few minutes, showing that the rate-determining
step changes to migration in the very early reaction stage.
For reaction (9.19), OH - ions move inward, while for reaction (9.20), electrons
move outward. This mechanism in which negative charges transfer in the opposite
direction is likely to decrease the activation energy for migration of OH - ions which
is the rate-determining step. By this decrease in the activation energy, the hydrogen
generation reaction proceeds easily at room temperature, resulting in the formation
of the thick silicon oxide layer of ∼5 nm thickness. It should be noted that in the
case of thermal oxidation of crystalline Si, formation of a ∼5 nm SiO 2 layer requires
temperatures above 700 ◦ C [48].
Figure 9.19 shows the hydrogen volume generated by the reaction of HF-etched
Si nanopowder with ultrapure water vs. the reaction time for two different crystallite
sizes. The hydrogen generation rate for smaller crystallite size Si nanopowder
produced by the two-step beads milling method (average crystallite size: 13.8 nm) is
1.4∼1.5 times higher than that for the larger crystallite size Si nanopowder (average
crystallite size 23.4 nm). The surface area estimated from the average crystallite
size is 190 m 2 /g for the two-step beads milled Si nanopowder and 110 m 2 /g for
the one-step beads milled Si nanopowder. The ratio of the hydrogen generation
rate of 1.4∼1.5 between the two-step and one-step beads milled Si nanopowders
is in reasonable agreement with the ratio of the surface area estimated from the
average crystallite sizes. Si nanopowder forms agglomerate as is evident from the
SEM micrograph (Fig. 9.20). The average sizes of Si agglomerates for one-step