

9 Si Nanopowder for Photoluminescence and Hydrogen Generation Materials
361
0
0.001
0.002
0.003
0.004
0.005
2.5
3.0
3.5
4.0
Absorbance
Photon Energy (eV)
0
0.01
0.02
0.03
0.04
0.05
0.06
2.5
3.0
3.5
4.0
Absorbance
Photon Energy (eV)
(b)
(a)
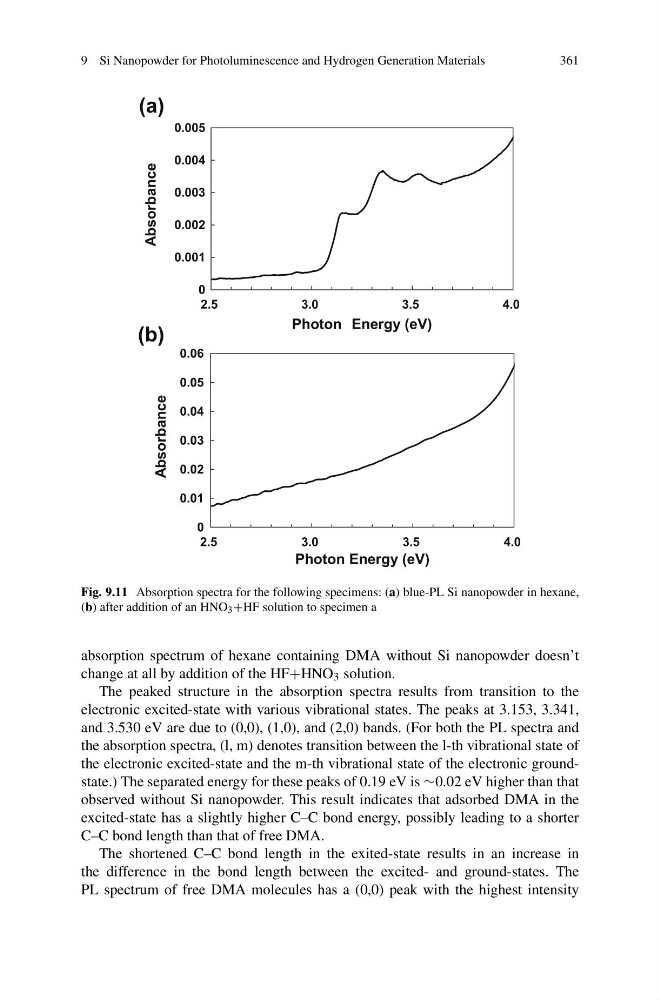
Fig. 9.11 Absorption spectra for the following specimens: (a) blue-PL Si nanopowder in hexane,
(b) after addition of an HNO 3 +HF solution to specimen a
absorption spectrum of hexane containing DMA without Si nanopowder doesn’t
change at all by addition of the HF+HNO 3 solution.
The peaked structure in the absorption spectra results from transition to the
electronic excited-state with various vibrational states. The peaks at 3.153, 3.341,
and 3.530 eV are due to (0,0), (1,0), and (2,0) bands. (For both the PL spectra and
the absorption spectra, (l, m) denotes transition between the l-th vibrational state of
the electronic excited-state and the m-th vibrational state of the electronic groundstate.) The separated energy for these peaks of 0.19 eV is ∼0.02 eV higher than that
observed without Si nanopowder. This result indicates that adsorbed DMA in the
excited-state has a slightly higher C–C bond energy, possibly leading to a shorter
C–C bond length than that of free DMA.
The shortened C–C bond length in the exited-state results in an increase in
the difference in the bond length between the excited- and ground-states. The
PL spectrum of free DMA molecules has a (0,0) peak with the highest intensity
361
0
0.001
0.002
0.003
0.004
0.005
2.5
3.0
3.5
4.0
Absorbance
Photon Energy (eV)
0
0.01
0.02
0.03
0.04
0.05
0.06
2.5
3.0
3.5
4.0
Absorbance
Photon Energy (eV)
(b)
(a)
Fig. 9.11 Absorption spectra for the following specimens: (a) blue-PL Si nanopowder in hexane,
(b) after addition of an HNO 3 +HF solution to specimen a
absorption spectrum of hexane containing DMA without Si nanopowder doesn’t
change at all by addition of the HF+HNO 3 solution.
The peaked structure in the absorption spectra results from transition to the
electronic excited-state with various vibrational states. The peaks at 3.153, 3.341,
and 3.530 eV are due to (0,0), (1,0), and (2,0) bands. (For both the PL spectra and
the absorption spectra, (l, m) denotes transition between the l-th vibrational state of
the electronic excited-state and the m-th vibrational state of the electronic groundstate.) The separated energy for these peaks of 0.19 eV is ∼0.02 eV higher than that
observed without Si nanopowder. This result indicates that adsorbed DMA in the
excited-state has a slightly higher C–C bond energy, possibly leading to a shorter
C–C bond length than that of free DMA.
The shortened C–C bond length in the exited-state results in an increase in
the difference in the bond length between the excited- and ground-states. The
PL spectrum of free DMA molecules has a (0,0) peak with the highest intensity