

9 Si Nanopowder for Photoluminescence and Hydrogen Generation Materials
359
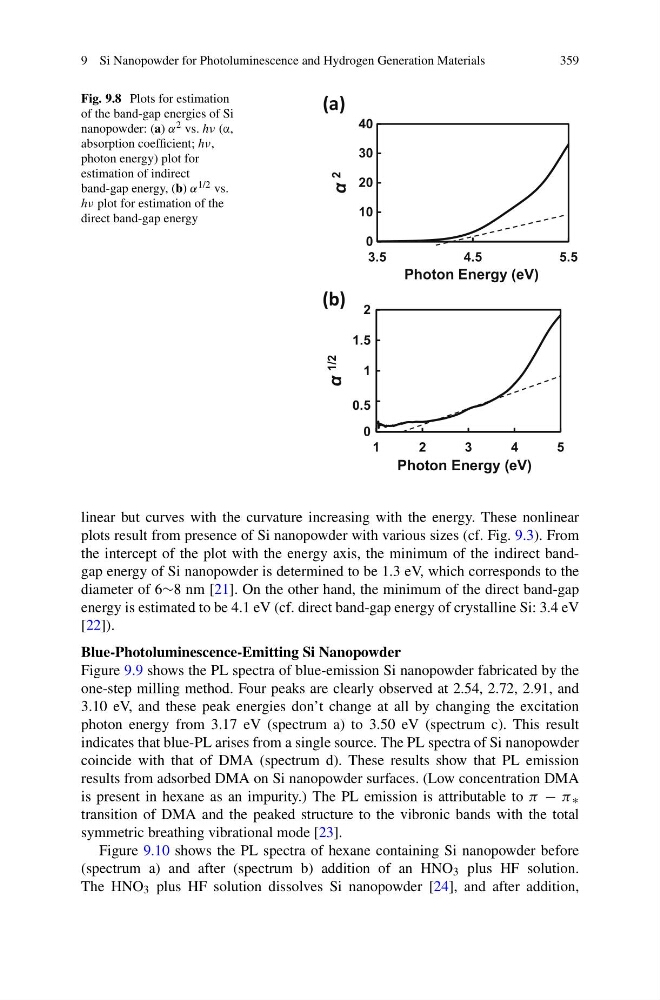
Fig. 9.8 Plots for estimation
of the band-gap energies of Si
nanopowder: (a) α 2 vs. hν (α,
absorption coefficient; hν,
photon energy) plot for
estimation of indirect
band-gap energy, (b) α 1/2 vs.
hν plot for estimation of the
direct band-gap energy
0
10
20
30
40
3.5
4.5
5.5
α 2
Photon Energy (eV)
0
0.5
1
1.5
2
1
2
3
4
5
α 1/2
Photon Energy (eV)
(a)
(b)
linear but curves with the curvature increasing with the energy. These nonlinear
plots result from presence of Si nanopowder with various sizes (cf. Fig. 9.3). From
the intercept of the plot with the energy axis, the minimum of the indirect bandgap energy of Si nanopowder is determined to be 1.3 eV, which corresponds to the
diameter of 6∼8 nm [21]. On the other hand, the minimum of the direct band-gap
energy is estimated to be 4.1 eV (cf. direct band-gap energy of crystalline Si: 3.4 eV
[22]).
Blue-Photoluminescence-Emitting Si Nanopowder
Figure 9.9 shows the PL spectra of blue-emission Si nanopowder fabricated by the
one-step milling method. Four peaks are clearly observed at 2.54, 2.72, 2.91, and
3.10 eV, and these peak energies don’t change at all by changing the excitation
photon energy from 3.17 eV (spectrum a) to 3.50 eV (spectrum c). This result
indicates that blue-PL arises from a single source. The PL spectra of Si nanopowder
coincide with that of DMA (spectrum d). These results show that PL emission
results from adsorbed DMA on Si nanopowder surfaces. (Low concentration DMA
is present in hexane as an impurity.) The PL emission is attributable to π − π ∗
transition of DMA and the peaked structure to the vibronic bands with the total
symmetric breathing vibrational mode [23].
Figure 9.10 shows the PL spectra of hexane containing Si nanopowder before
(spectrum a) and after (spectrum b) addition of an HNO 3 plus HF solution.
The HNO 3 plus HF solution dissolves Si nanopowder [24], and after addition,
359
Fig. 9.8 Plots for estimation
of the band-gap energies of Si
nanopowder: (a) α 2 vs. hν (α,
absorption coefficient; hν,
photon energy) plot for
estimation of indirect
band-gap energy, (b) α 1/2 vs.
hν plot for estimation of the
direct band-gap energy
0
10
20
30
40
3.5
4.5
5.5
α 2
Photon Energy (eV)
0
0.5
1
1.5
2
1
2
3
4
5
α 1/2
Photon Energy (eV)
(a)
(b)
linear but curves with the curvature increasing with the energy. These nonlinear
plots result from presence of Si nanopowder with various sizes (cf. Fig. 9.3). From
the intercept of the plot with the energy axis, the minimum of the indirect bandgap energy of Si nanopowder is determined to be 1.3 eV, which corresponds to the
diameter of 6∼8 nm [21]. On the other hand, the minimum of the direct band-gap
energy is estimated to be 4.1 eV (cf. direct band-gap energy of crystalline Si: 3.4 eV
[22]).
Blue-Photoluminescence-Emitting Si Nanopowder
Figure 9.9 shows the PL spectra of blue-emission Si nanopowder fabricated by the
one-step milling method. Four peaks are clearly observed at 2.54, 2.72, 2.91, and
3.10 eV, and these peak energies don’t change at all by changing the excitation
photon energy from 3.17 eV (spectrum a) to 3.50 eV (spectrum c). This result
indicates that blue-PL arises from a single source. The PL spectra of Si nanopowder
coincide with that of DMA (spectrum d). These results show that PL emission
results from adsorbed DMA on Si nanopowder surfaces. (Low concentration DMA
is present in hexane as an impurity.) The PL emission is attributable to π − π ∗
transition of DMA and the peaked structure to the vibronic bands with the total
symmetric breathing vibrational mode [23].
Figure 9.10 shows the PL spectra of hexane containing Si nanopowder before
(spectrum a) and after (spectrum b) addition of an HNO 3 plus HF solution.
The HNO 3 plus HF solution dissolves Si nanopowder [24], and after addition,