

358
Y. Kobayashi and H. Kobayashi
(a)
(b)
PL
( )
( )
band -gap
wide
narrow
crystallite size
ll
l
band -gap
wide
narrow
crystallite size
ll
l
small
large
small
large
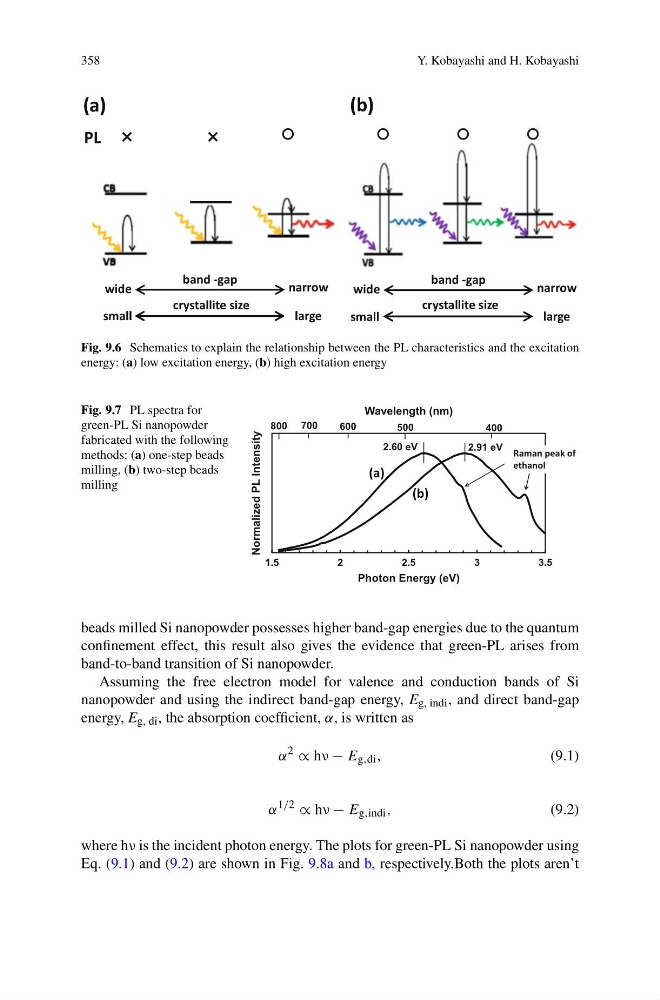
Fig. 9.6 Schematics to explain the relationship between the PL characteristics and the excitation
energy: (a) low excitation energy, (b) high excitation energy
Fig. 9.7 PL spectra for
green-PL Si nanopowder
fabricated with the following
methods: (a) one-step beads
milling, (b) two-step beads
milling
1 . 5
2
2 . 5
3
3 . 5
Normalized PL Intensity
Photon Energy (eV)
400
500
600
700
800
Wavelength (nm)
2.91 eV
2.60 eV
Raman peak of
ethanol
(a)
(b)
beads milled Si nanopowder possesses higher band-gap energies due to the quantum
confinement effect, this result also gives the evidence that green-PL arises from
band-to-band transition of Si nanopowder.
Assuming the free electron model for valence and conduction bands of Si
nanopowder and using the indirect band-gap energy, E g, indi , and direct band-gap
energy, E g, di , the absorption coefficient, α, is written as
α
2
∝ hν − E g,di ,
(9.1)
α
1/2
∝ hν − E g,indi ,
(9.2)
where hν is the incident photon energy. The plots for green-PL Si nanopowder using
Eq. (9.1) and (9.2) are shown in Fig. 9.8a and b, respectively.Both the plots aren’t
Y. Kobayashi and H. Kobayashi
(a)
(b)
PL
( )
( )
band -gap
wide
narrow
crystallite size
ll
l
band -gap
wide
narrow
crystallite size
ll
l
small
large
small
large
Fig. 9.6 Schematics to explain the relationship between the PL characteristics and the excitation
energy: (a) low excitation energy, (b) high excitation energy
Fig. 9.7 PL spectra for
green-PL Si nanopowder
fabricated with the following
methods: (a) one-step beads
milling, (b) two-step beads
milling
1 . 5
2
2 . 5
3
3 . 5
Normalized PL Intensity
Photon Energy (eV)
400
500
600
700
800
Wavelength (nm)
2.91 eV
2.60 eV
Raman peak of
ethanol
(a)
(b)
beads milled Si nanopowder possesses higher band-gap energies due to the quantum
confinement effect, this result also gives the evidence that green-PL arises from
band-to-band transition of Si nanopowder.
Assuming the free electron model for valence and conduction bands of Si
nanopowder and using the indirect band-gap energy, E g, indi , and direct band-gap
energy, E g, di , the absorption coefficient, α, is written as
α
2
∝ hν − E g,di ,
(9.1)
α
1/2
∝ hν − E g,indi ,
(9.2)
where hν is the incident photon energy. The plots for green-PL Si nanopowder using
Eq. (9.1) and (9.2) are shown in Fig. 9.8a and b, respectively.Both the plots aren’t