

9 Si Nanopowder for Photoluminescence and Hydrogen Generation Materials
357
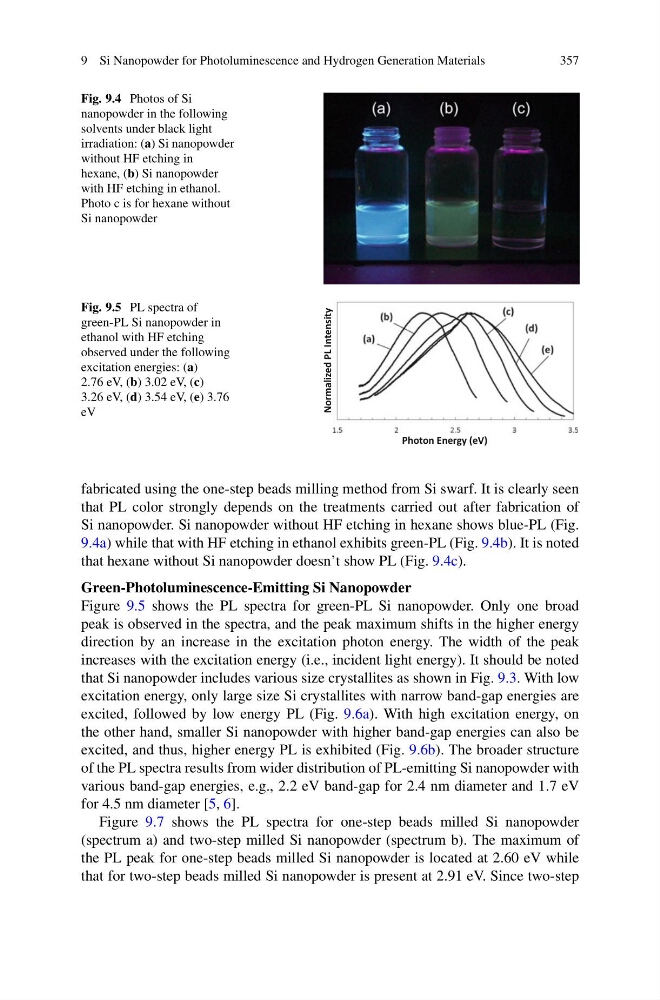
Fig. 9.4 Photos of Si
nanopowder in the following
solvents under black light
irradiation: (a) Si nanopowder
without HF etching in
hexane, (b) Si nanopowder
with HF etching in ethanol.
Photo c is for hexane without
Si nanopowder
Fig. 9.5 PL spectra of
green-PL Si nanopowder in
ethanol with HF etching
observed under the following
excitation energies: (a)
2.76 eV, (b) 3.02 eV, (c)
3.26 eV, (d) 3.54 eV, (e) 3.76
eV
Photon Energy (eV)
Normalized PL Intensity
fabricated using the one-step beads milling method from Si swarf. It is clearly seen
that PL color strongly depends on the treatments carried out after fabrication of
Si nanopowder. Si nanopowder without HF etching in hexane shows blue-PL (Fig.
9.4a) while that with HF etching in ethanol exhibits green-PL (Fig. 9.4b). It is noted
that hexane without Si nanopowder doesn’t show PL (Fig. 9.4c).
Green-Photoluminescence-Emitting Si Nanopowder
Figure 9.5 shows the PL spectra for green-PL Si nanopowder. Only one broad
peak is observed in the spectra, and the peak maximum shifts in the higher energy
direction by an increase in the excitation photon energy. The width of the peak
increases with the excitation energy (i.e., incident light energy). It should be noted
that Si nanopowder includes various size crystallites as shown in Fig. 9.3. With low
excitation energy, only large size Si crystallites with narrow band-gap energies are
excited, followed by low energy PL (Fig. 9.6a). With high excitation energy, on
the other hand, smaller Si nanopowder with higher band-gap energies can also be
excited, and thus, higher energy PL is exhibited (Fig. 9.6b). The broader structure
of the PL spectra results from wider distribution of PL-emitting Si nanopowder with
various band-gap energies, e.g., 2.2 eV band-gap for 2.4 nm diameter and 1.7 eV
for 4.5 nm diameter [5, 6].
Figure 9.7 shows the PL spectra for one-step beads milled Si nanopowder
(spectrum a) and two-step milled Si nanopowder (spectrum b). The maximum of
the PL peak for one-step beads milled Si nanopowder is located at 2.60 eV while
that for two-step beads milled Si nanopowder is present at 2.91 eV. Since two-step
357
Fig. 9.4 Photos of Si
nanopowder in the following
solvents under black light
irradiation: (a) Si nanopowder
without HF etching in
hexane, (b) Si nanopowder
with HF etching in ethanol.
Photo c is for hexane without
Si nanopowder
Fig. 9.5 PL spectra of
green-PL Si nanopowder in
ethanol with HF etching
observed under the following
excitation energies: (a)
2.76 eV, (b) 3.02 eV, (c)
3.26 eV, (d) 3.54 eV, (e) 3.76
eV
Photon Energy (eV)
Normalized PL Intensity
fabricated using the one-step beads milling method from Si swarf. It is clearly seen
that PL color strongly depends on the treatments carried out after fabrication of
Si nanopowder. Si nanopowder without HF etching in hexane shows blue-PL (Fig.
9.4a) while that with HF etching in ethanol exhibits green-PL (Fig. 9.4b). It is noted
that hexane without Si nanopowder doesn’t show PL (Fig. 9.4c).
Green-Photoluminescence-Emitting Si Nanopowder
Figure 9.5 shows the PL spectra for green-PL Si nanopowder. Only one broad
peak is observed in the spectra, and the peak maximum shifts in the higher energy
direction by an increase in the excitation photon energy. The width of the peak
increases with the excitation energy (i.e., incident light energy). It should be noted
that Si nanopowder includes various size crystallites as shown in Fig. 9.3. With low
excitation energy, only large size Si crystallites with narrow band-gap energies are
excited, followed by low energy PL (Fig. 9.6a). With high excitation energy, on
the other hand, smaller Si nanopowder with higher band-gap energies can also be
excited, and thus, higher energy PL is exhibited (Fig. 9.6b). The broader structure
of the PL spectra results from wider distribution of PL-emitting Si nanopowder with
various band-gap energies, e.g., 2.2 eV band-gap for 2.4 nm diameter and 1.7 eV
for 4.5 nm diameter [5, 6].
Figure 9.7 shows the PL spectra for one-step beads milled Si nanopowder
(spectrum a) and two-step milled Si nanopowder (spectrum b). The maximum of
the PL peak for one-step beads milled Si nanopowder is located at 2.60 eV while
that for two-step beads milled Si nanopowder is present at 2.91 eV. Since two-step