

356
Y. Kobayashi and H. Kobayashi
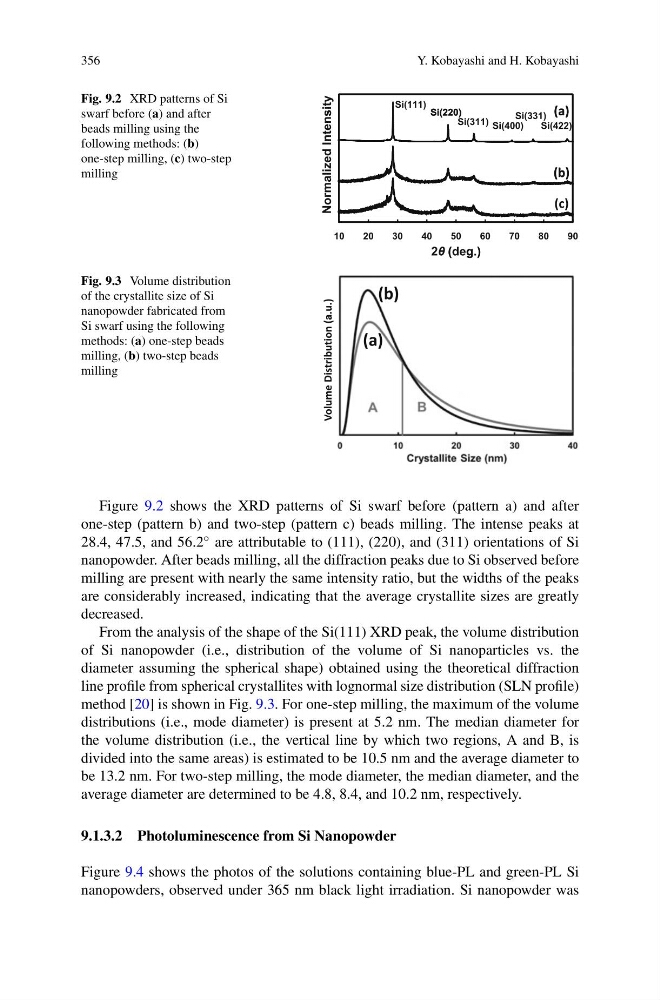
Fig. 9.2 XRD patterns of Si
swarf before (a) and after
beads milling using the
following methods: (b)
one-step milling, (c) two-step
milling
Fig. 9.3 Volume distribution
of the crystallite size of Si
nanopowder fabricated from
Si swarf using the following
methods: (a) one-step beads
milling, (b) two-step beads
milling
(b)
a.u.)
(a)
bution (a
me Distri
Volum
Figure 9.2 shows the XRD patterns of Si swarf before (pattern a) and after
one-step (pattern b) and two-step (pattern c) beads milling. The intense peaks at
28.4, 47.5, and 56.2 ◦ are attributable to (111), (220), and (311) orientations of Si
nanopowder. After beads milling, all the diffraction peaks due to Si observed before
milling are present with nearly the same intensity ratio, but the widths of the peaks
are considerably increased, indicating that the average crystallite sizes are greatly
decreased.
From the analysis of the shape of the Si(111) XRD peak, the volume distribution
of Si nanopowder (i.e., distribution of the volume of Si nanoparticles vs. the
diameter assuming the spherical shape) obtained using the theoretical diffraction
line profile from spherical crystallites with lognormal size distribution (SLN profile)
method [20] is shown in Fig. 9.3. For one-step milling, the maximum of the volume
distributions (i.e., mode diameter) is present at 5.2 nm. The median diameter for
the volume distribution (i.e., the vertical line by which two regions, A and B, is
divided into the same areas) is estimated to be 10.5 nm and the average diameter to
be 13.2 nm. For two-step milling, the mode diameter, the median diameter, and the
average diameter are determined to be 4.8, 8.4, and 10.2 nm, respectively.
9.1.3.2 Photoluminescence from Si Nanopowder
Figure 9.4 shows the photos of the solutions containing blue-PL and green-PL Si
nanopowders, observed under 365 nm black light irradiation. Si nanopowder was
Y. Kobayashi and H. Kobayashi
Fig. 9.2 XRD patterns of Si
swarf before (a) and after
beads milling using the
following methods: (b)
one-step milling, (c) two-step
milling
Fig. 9.3 Volume distribution
of the crystallite size of Si
nanopowder fabricated from
Si swarf using the following
methods: (a) one-step beads
milling, (b) two-step beads
milling
(b)
a.u.)
(a)
bution (a
me Distri
Volum
Figure 9.2 shows the XRD patterns of Si swarf before (pattern a) and after
one-step (pattern b) and two-step (pattern c) beads milling. The intense peaks at
28.4, 47.5, and 56.2 ◦ are attributable to (111), (220), and (311) orientations of Si
nanopowder. After beads milling, all the diffraction peaks due to Si observed before
milling are present with nearly the same intensity ratio, but the widths of the peaks
are considerably increased, indicating that the average crystallite sizes are greatly
decreased.
From the analysis of the shape of the Si(111) XRD peak, the volume distribution
of Si nanopowder (i.e., distribution of the volume of Si nanoparticles vs. the
diameter assuming the spherical shape) obtained using the theoretical diffraction
line profile from spherical crystallites with lognormal size distribution (SLN profile)
method [20] is shown in Fig. 9.3. For one-step milling, the maximum of the volume
distributions (i.e., mode diameter) is present at 5.2 nm. The median diameter for
the volume distribution (i.e., the vertical line by which two regions, A and B, is
divided into the same areas) is estimated to be 10.5 nm and the average diameter to
be 13.2 nm. For two-step milling, the mode diameter, the median diameter, and the
average diameter are determined to be 4.8, 8.4, and 10.2 nm, respectively.
9.1.3.2 Photoluminescence from Si Nanopowder
Figure 9.4 shows the photos of the solutions containing blue-PL and green-PL Si
nanopowders, observed under 365 nm black light irradiation. Si nanopowder was