

188
S. Taioli
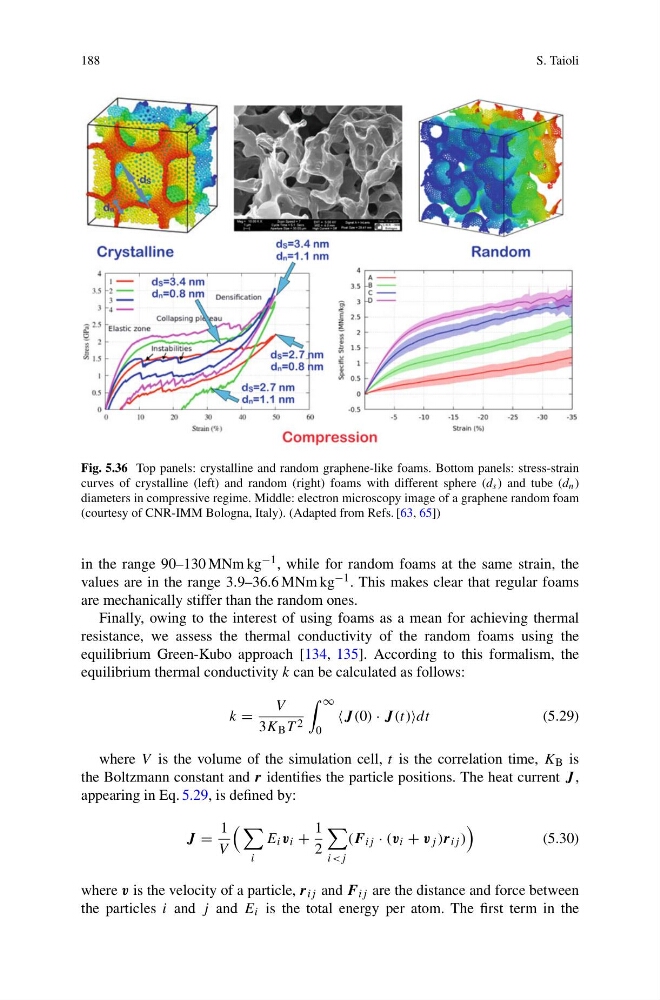
Fig. 5.36 Top panels: crystalline and random graphene-like foams. Bottom panels: stress-strain
curves of crystalline (left) and random (right) foams with different sphere (d s ) and tube (d n )
diameters in compressive regime. Middle: electron microscopy image of a graphene random foam
(courtesy of CNR-IMM Bologna, Italy). (Adapted from Refs. [63, 65])
in the range 90–130 MNm kg −1 , while for random foams at the same strain, the
values are in the range 3.9–36.6 MNm kg −1 . This makes clear that regular foams
are mechanically stiffer than the random ones.
Finally, owing to the interest of using foams as a mean for achieving thermal
resistance, we assess the thermal conductivity of the random foams using the
equilibrium Green-Kubo approach [134, 135]. According to this formalism, the
equilibrium thermal conductivity k can be calculated as follows:
k =
V
3K B T 2
∞
0
J (0) · J (t)dt
(5.29)
where V is the volume of the simulation cell, t is the correlation time, K B is
the Boltzmann constant and r identifies the particle positions. The heat current J ,
appearing in Eq. 5.29, is defined by:
J =
1
V
i
E i v i +
1
2
i
(5.30)
where v is the velocity of a particle, r ij and F ij are the distance and force between
the particles i and j and E i is the total energy per atom. The first term in the
S. Taioli
Fig. 5.36 Top panels: crystalline and random graphene-like foams. Bottom panels: stress-strain
curves of crystalline (left) and random (right) foams with different sphere (d s ) and tube (d n )
diameters in compressive regime. Middle: electron microscopy image of a graphene random foam
(courtesy of CNR-IMM Bologna, Italy). (Adapted from Refs. [63, 65])
in the range 90–130 MNm kg −1 , while for random foams at the same strain, the
values are in the range 3.9–36.6 MNm kg −1 . This makes clear that regular foams
are mechanically stiffer than the random ones.
Finally, owing to the interest of using foams as a mean for achieving thermal
resistance, we assess the thermal conductivity of the random foams using the
equilibrium Green-Kubo approach [134, 135]. According to this formalism, the
equilibrium thermal conductivity k can be calculated as follows:
k =
V
3K B T 2
∞
0
J (0) · J (t)dt
(5.29)
where V is the volume of the simulation cell, t is the correlation time, K B is
the Boltzmann constant and r identifies the particle positions. The heat current J ,
appearing in Eq. 5.29, is defined by:
J =
1
V
i
E i v i +
1
2
i
(5.30)
where v is the velocity of a particle, r ij and F ij are the distance and force between
the particles i and j and E i is the total energy per atom. The first term in the