

5 Enabling Materials By Dimensionality: From 0D to 3D Carbon-Based. . .
185
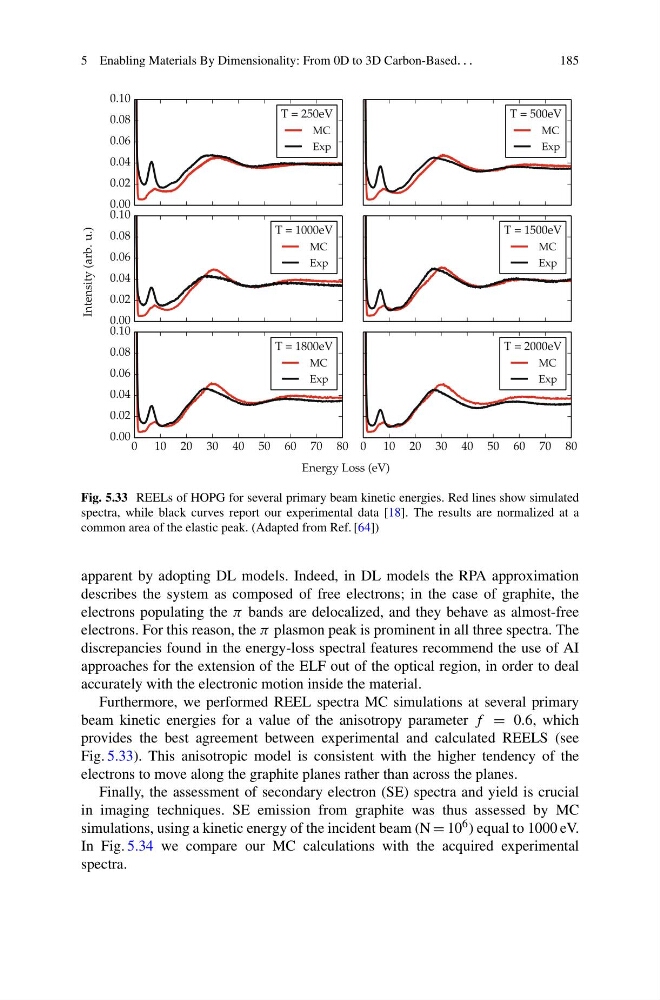
Fig. 5.33 REELs of HOPG for several primary beam kinetic energies. Red lines show simulated
spectra, while black curves report our experimental data [18]. The results are normalized at a
common area of the elastic peak. (Adapted from Ref. [64])
apparent by adopting DL models. Indeed, in DL models the RPA approximation
describes the system as composed of free electrons; in the case of graphite, the
electrons populating the π bands are delocalized, and they behave as almost-free
electrons. For this reason, the π plasmon peak is prominent in all three spectra. The
discrepancies found in the energy-loss spectral features recommend the use of AI
approaches for the extension of the ELF out of the optical region, in order to deal
accurately with the electronic motion inside the material.
Furthermore, we performed REEL spectra MC simulations at several primary
beam kinetic energies for a value of the anisotropy parameter f = 0.6, which
provides the best agreement between experimental and calculated REELS (see
Fig. 5.33). This anisotropic model is consistent with the higher tendency of the
electrons to move along the graphite planes rather than across the planes.
Finally, the assessment of secondary electron (SE) spectra and yield is crucial
in imaging techniques. SE emission from graphite was thus assessed by MC
simulations, using a kinetic energy of the incident beam (N = 10 6 ) equal to 1000 eV.
In Fig. 5.34 we compare our MC calculations with the acquired experimental
spectra.
185
Fig. 5.33 REELs of HOPG for several primary beam kinetic energies. Red lines show simulated
spectra, while black curves report our experimental data [18]. The results are normalized at a
common area of the elastic peak. (Adapted from Ref. [64])
apparent by adopting DL models. Indeed, in DL models the RPA approximation
describes the system as composed of free electrons; in the case of graphite, the
electrons populating the π bands are delocalized, and they behave as almost-free
electrons. For this reason, the π plasmon peak is prominent in all three spectra. The
discrepancies found in the energy-loss spectral features recommend the use of AI
approaches for the extension of the ELF out of the optical region, in order to deal
accurately with the electronic motion inside the material.
Furthermore, we performed REEL spectra MC simulations at several primary
beam kinetic energies for a value of the anisotropy parameter f = 0.6, which
provides the best agreement between experimental and calculated REELS (see
Fig. 5.33). This anisotropic model is consistent with the higher tendency of the
electrons to move along the graphite planes rather than across the planes.
Finally, the assessment of secondary electron (SE) spectra and yield is crucial
in imaging techniques. SE emission from graphite was thus assessed by MC
simulations, using a kinetic energy of the incident beam (N = 10 6 ) equal to 1000 eV.
In Fig. 5.34 we compare our MC calculations with the acquired experimental
spectra.