

184
S. Taioli
agreement with experiments. We can conclude that at least in the case of insulators,
due to the strongly inhomogeneous electron density and, thus, to the complexity of
the dielectric response, the DL model is quantitatively less accurate than a full AI
approach in the prediction of the experimental REELS. This behaviour worsens at
higher transferred momenta, where particle-hole excitations, rather than collective
plasma excitation, come into play. Single-particle excitations generally cannot be
well described by a simple RPA or by the DL model of the ELF, while TDDFT AI
simulations are also able to take into account these spectral features.
Graphite
Highly oriented pyrolytic graphite (HOPG) crystals were considered to have a
density of 2.25 g/cm 3 [123]. The band gap was set equal to 0.06 eV according to
our DFT calculations. MC simulations of REELS were carried out using the three
different approaches to the calculation of the ELF mentioned above, with a number
of electrons in the beam equal to 10 9 . Initially, only the in-plane component of
the energy-loss function was dealt within the calculation (i.e. we considered the
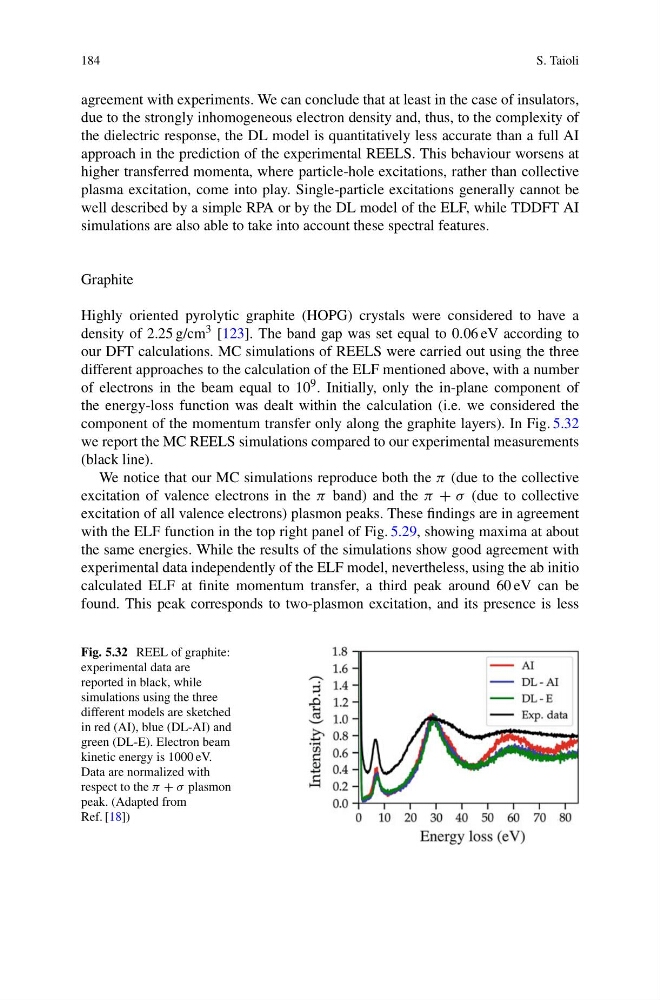
component of the momentum transfer only along the graphite layers). In Fig. 5.32
we report the MC REELS simulations compared to our experimental measurements
(black line).
We notice that our MC simulations reproduce both the π (due to the collective
excitation of valence electrons in the π band) and the π + σ (due to collective
excitation of all valence electrons) plasmon peaks. These findings are in agreement
with the ELF function in the top right panel of Fig. 5.29, showing maxima at about
the same energies. While the results of the simulations show good agreement with
experimental data independently of the ELF model, nevertheless, using the ab initio
calculated ELF at finite momentum transfer, a third peak around 60 eV can be
found. This peak corresponds to two-plasmon excitation, and its presence is less
Fig. 5.32 REEL of graphite:
experimental data are
reported in black, while
simulations using the three
different models are sketched
in red (AI), blue (DL-AI) and
green (DL-E). Electron beam
kinetic energy is 1000 eV.
Data are normalized with
respect to the π + σ plasmon
peak. (Adapted from
Ref. [18])
S. Taioli
agreement with experiments. We can conclude that at least in the case of insulators,
due to the strongly inhomogeneous electron density and, thus, to the complexity of
the dielectric response, the DL model is quantitatively less accurate than a full AI
approach in the prediction of the experimental REELS. This behaviour worsens at
higher transferred momenta, where particle-hole excitations, rather than collective
plasma excitation, come into play. Single-particle excitations generally cannot be
well described by a simple RPA or by the DL model of the ELF, while TDDFT AI
simulations are also able to take into account these spectral features.
Graphite
Highly oriented pyrolytic graphite (HOPG) crystals were considered to have a
density of 2.25 g/cm 3 [123]. The band gap was set equal to 0.06 eV according to
our DFT calculations. MC simulations of REELS were carried out using the three
different approaches to the calculation of the ELF mentioned above, with a number
of electrons in the beam equal to 10 9 . Initially, only the in-plane component of
the energy-loss function was dealt within the calculation (i.e. we considered the
component of the momentum transfer only along the graphite layers). In Fig. 5.32
we report the MC REELS simulations compared to our experimental measurements
(black line).
We notice that our MC simulations reproduce both the π (due to the collective
excitation of valence electrons in the π band) and the π + σ (due to collective
excitation of all valence electrons) plasmon peaks. These findings are in agreement
with the ELF function in the top right panel of Fig. 5.29, showing maxima at about
the same energies. While the results of the simulations show good agreement with
experimental data independently of the ELF model, nevertheless, using the ab initio
calculated ELF at finite momentum transfer, a third peak around 60 eV can be
found. This peak corresponds to two-plasmon excitation, and its presence is less
Fig. 5.32 REEL of graphite:
experimental data are
reported in black, while
simulations using the three
different models are sketched
in red (AI), blue (DL-AI) and
green (DL-E). Electron beam
kinetic energy is 1000 eV.
Data are normalized with
respect to the π + σ plasmon
peak. (Adapted from
Ref. [18])