

5 Enabling Materials By Dimensionality: From 0D to 3D Carbon-Based. . .
183
for performing these simulations are embedded in the in-house developed code suite
SURPRISES [131–133].
5.6.1.3 Monte Carlo Simulations of Energy-Loss Spectra and Secondary
Electron Yield
Diamond
To compare our experimental REELS data of diamond with the three different
models of ELF presented above, we performed Monte Carlo (MC) simulations
following the scheme reported in Sect. 5.6.1.2. In our MC simulations, diamond
crystals are approximated by a homogeneous system with density 3.515 g/cm 3
[123]. Thus, in our simulations we assume that the ELF is almost similar in all
directions, and thus we can retain our simulated ELF along the L direction only
for calculating the energy-loss spectra. The band gap of diamond was set equal
to 4.16 eV. The electron beam direction is orthogonal to the target surface, and
the initial kinetic energy ranges from 250 to 2000 eV. The number of impinging
electrons is 10 9 .
First, we notice that in our treatment we define more generally as backscattered
electrons those beam electrons that are reflected back out of the specimen after
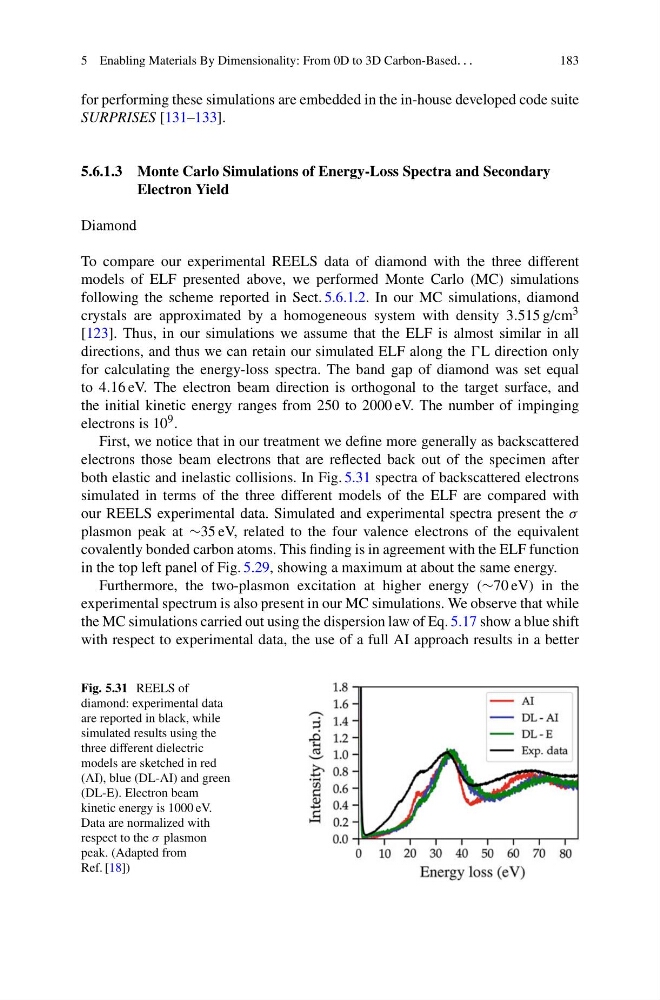
both elastic and inelastic collisions. In Fig. 5.31 spectra of backscattered electrons
simulated in terms of the three different models of the ELF are compared with
our REELS experimental data. Simulated and experimental spectra present the σ
plasmon peak at ∼35 eV, related to the four valence electrons of the equivalent
covalently bonded carbon atoms. This finding is in agreement with the ELF function
in the top left panel of Fig. 5.29, showing a maximum at about the same energy.
Furthermore, the two-plasmon excitation at higher energy (∼70 eV) in the
experimental spectrum is also present in our MC simulations. We observe that while
the MC simulations carried out using the dispersion law of Eq. 5.17 show a blue shift
with respect to experimental data, the use of a full AI approach results in a better
Fig. 5.31 REELS of
diamond: experimental data
are reported in black, while
simulated results using the
three different dielectric
models are sketched in red
(AI), blue (DL-AI) and green
(DL-E). Electron beam
kinetic energy is 1000 eV.
Data are normalized with
respect to the σ plasmon
peak. (Adapted from
Ref. [18])
183
for performing these simulations are embedded in the in-house developed code suite
SURPRISES [131–133].
5.6.1.3 Monte Carlo Simulations of Energy-Loss Spectra and Secondary
Electron Yield
Diamond
To compare our experimental REELS data of diamond with the three different
models of ELF presented above, we performed Monte Carlo (MC) simulations
following the scheme reported in Sect. 5.6.1.2. In our MC simulations, diamond
crystals are approximated by a homogeneous system with density 3.515 g/cm 3
[123]. Thus, in our simulations we assume that the ELF is almost similar in all
directions, and thus we can retain our simulated ELF along the L direction only
for calculating the energy-loss spectra. The band gap of diamond was set equal
to 4.16 eV. The electron beam direction is orthogonal to the target surface, and
the initial kinetic energy ranges from 250 to 2000 eV. The number of impinging
electrons is 10 9 .
First, we notice that in our treatment we define more generally as backscattered
electrons those beam electrons that are reflected back out of the specimen after
both elastic and inelastic collisions. In Fig. 5.31 spectra of backscattered electrons
simulated in terms of the three different models of the ELF are compared with
our REELS experimental data. Simulated and experimental spectra present the σ
plasmon peak at ∼35 eV, related to the four valence electrons of the equivalent
covalently bonded carbon atoms. This finding is in agreement with the ELF function
in the top left panel of Fig. 5.29, showing a maximum at about the same energy.
Furthermore, the two-plasmon excitation at higher energy (∼70 eV) in the
experimental spectrum is also present in our MC simulations. We observe that while
the MC simulations carried out using the dispersion law of Eq. 5.17 show a blue shift
with respect to experimental data, the use of a full AI approach results in a better
Fig. 5.31 REELS of
diamond: experimental data
are reported in black, while
simulated results using the
three different dielectric
models are sketched in red
(AI), blue (DL-AI) and green
(DL-E). Electron beam
kinetic energy is 1000 eV.
Data are normalized with
respect to the σ plasmon
peak. (Adapted from
Ref. [18])