

4 Nanoscale First-Principles Electronic Structure Simulations of Materials. . .
109
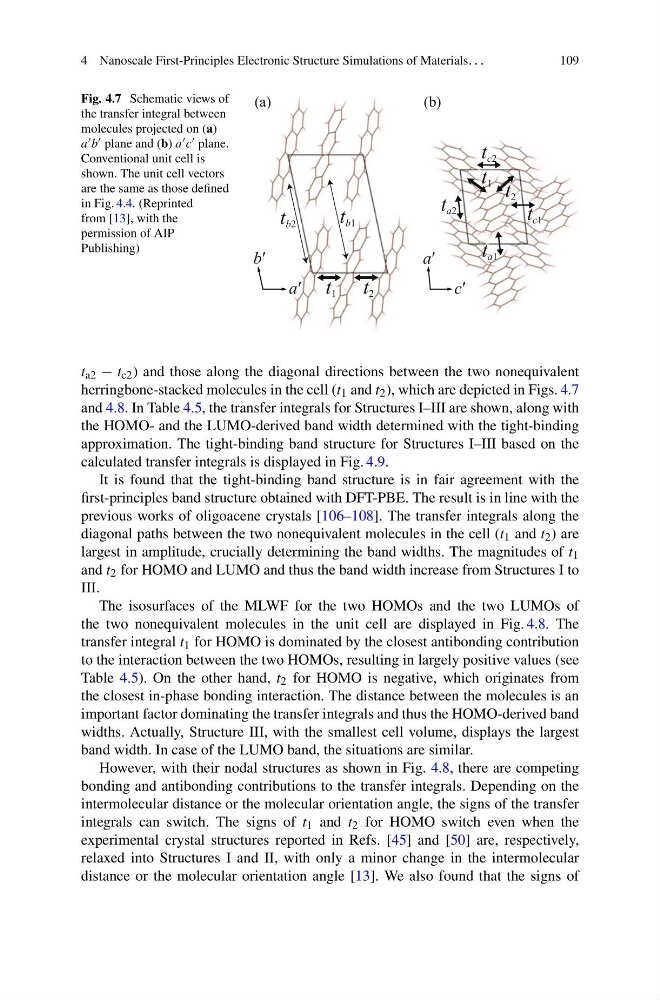
Fig. 4.7 Schematic views of
the transfer integral between
molecules projected on (a)
a b plane and (b) a c plane.
Conventional unit cell is
shown. The unit cell vectors
are the same as those defined
in Fig. 4.4. (Reprinted
from [13], with the
permission of AIP
Publishing)
(a)
(b)
a′
b′
a′
c′
t 1 t 2
t c1
t c2
t a1
t a2
t 1 t 2
t b1
t b2
t a2 − t c2 ) and those along the diagonal directions between the two nonequivalent
herringbone-stacked molecules in the cell (t 1 and t 2 ), which are depicted in Figs. 4.7
and 4.8. In Table 4.5, the transfer integrals for Structures I–III are shown, along with
the HOMO- and the LUMO-derived band width determined with the tight-binding
approximation. The tight-binding band structure for Structures I–III based on the
calculated transfer integrals is displayed in Fig. 4.9.
It is found that the tight-binding band structure is in fair agreement with the
first-principles band structure obtained with DFT-PBE. The result is in line with the
previous works of oligoacene crystals [106–108]. The transfer integrals along the
diagonal paths between the two nonequivalent molecules in the cell (t 1 and t 2 ) are
largest in amplitude, crucially determining the band widths. The magnitudes of t 1
and t 2 for HOMO and LUMO and thus the band width increase from Structures I to
III.
The isosurfaces of the MLWF for the two HOMOs and the two LUMOs of
the two nonequivalent molecules in the unit cell are displayed in Fig. 4.8. The
transfer integral t 1 for HOMO is dominated by the closest antibonding contribution
to the interaction between the two HOMOs, resulting in largely positive values (see
Table 4.5). On the other hand, t 2 for HOMO is negative, which originates from
the closest in-phase bonding interaction. The distance between the molecules is an
important factor dominating the transfer integrals and thus the HOMO-derived band
widths. Actually, Structure III, with the smallest cell volume, displays the largest
band width. In case of the LUMO band, the situations are similar.
However, with their nodal structures as shown in Fig. 4.8, there are competing
bonding and antibonding contributions to the transfer integrals. Depending on the
intermolecular distance or the molecular orientation angle, the signs of the transfer
integrals can switch. The signs of t 1 and t 2 for HOMO switch even when the
experimental crystal structures reported in Refs. [45] and [50] are, respectively,
relaxed into Structures I and II, with only a minor change in the intermolecular
distance or the molecular orientation angle [13]. We also found that the signs of
109
Fig. 4.7 Schematic views of
the transfer integral between
molecules projected on (a)
a b plane and (b) a c plane.
Conventional unit cell is
shown. The unit cell vectors
are the same as those defined
in Fig. 4.4. (Reprinted
from [13], with the
permission of AIP
Publishing)
(a)
(b)
a′
b′
a′
c′
t 1 t 2
t c1
t c2
t a1
t a2
t 1 t 2
t b1
t b2
t a2 − t c2 ) and those along the diagonal directions between the two nonequivalent
herringbone-stacked molecules in the cell (t 1 and t 2 ), which are depicted in Figs. 4.7
and 4.8. In Table 4.5, the transfer integrals for Structures I–III are shown, along with
the HOMO- and the LUMO-derived band width determined with the tight-binding
approximation. The tight-binding band structure for Structures I–III based on the
calculated transfer integrals is displayed in Fig. 4.9.
It is found that the tight-binding band structure is in fair agreement with the
first-principles band structure obtained with DFT-PBE. The result is in line with the
previous works of oligoacene crystals [106–108]. The transfer integrals along the
diagonal paths between the two nonequivalent molecules in the cell (t 1 and t 2 ) are
largest in amplitude, crucially determining the band widths. The magnitudes of t 1
and t 2 for HOMO and LUMO and thus the band width increase from Structures I to
III.
The isosurfaces of the MLWF for the two HOMOs and the two LUMOs of
the two nonequivalent molecules in the unit cell are displayed in Fig. 4.8. The
transfer integral t 1 for HOMO is dominated by the closest antibonding contribution
to the interaction between the two HOMOs, resulting in largely positive values (see
Table 4.5). On the other hand, t 2 for HOMO is negative, which originates from
the closest in-phase bonding interaction. The distance between the molecules is an
important factor dominating the transfer integrals and thus the HOMO-derived band
widths. Actually, Structure III, with the smallest cell volume, displays the largest
band width. In case of the LUMO band, the situations are similar.
However, with their nodal structures as shown in Fig. 4.8, there are competing
bonding and antibonding contributions to the transfer integrals. Depending on the
intermolecular distance or the molecular orientation angle, the signs of the transfer
integrals can switch. The signs of t 1 and t 2 for HOMO switch even when the
experimental crystal structures reported in Refs. [45] and [50] are, respectively,
relaxed into Structures I and II, with only a minor change in the intermolecular
distance or the molecular orientation angle [13]. We also found that the signs of