

Processes 2019, 7,97
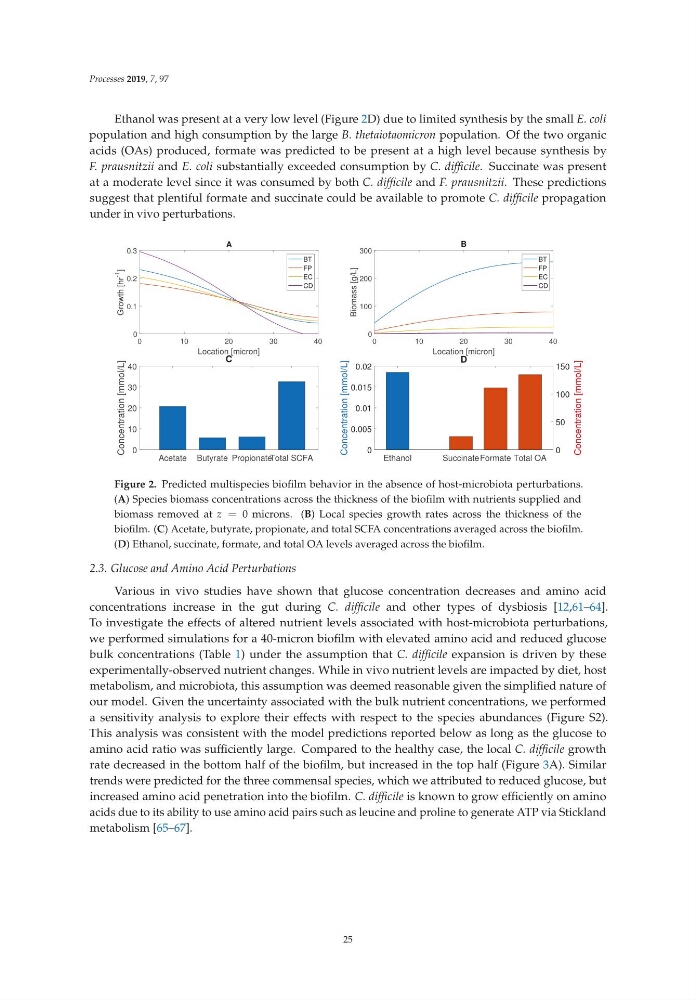
Ethanol was present at a very low level (Figure 2D) due to limited synthesis by the small E. coli
population and high consumption by the large B. thetaiotaomicron population. Of the two organic
acids (OAs) produced, formate was predicted to be present at a high level because synthesis by
F. prausnitzii and E. coli substantially exceeded consumption by C. difficile. Succinate was present
at a moderate level since it was consumed by both C. difficile and F. prausnitzii. These predictions
suggest that plentiful formate and succinate could be available to promote C. difficile propagation
under in vivo perturbations.
0
1 02 03 04 0
Location [micron]
0
0.1
0.2
0.3
Growth [hr
-1
]
A
BT
FP
EC
CD
0
1 02 03 04 0
Location [micron]
0
100
200
300
Biomass [g/L]
B
BT
FP
EC
CD
Acetate Butyrate PropionateTotal SCFA
0
10
20
30
40
Concentration [mmol/L]
C
Ethanol
SuccinateFormate Total OA
0
0.005
0.01
0.015
0.02
Concentration [mmol/L]
0
50
100
150
Concentration [mmol/L]
D
Figure 2. Predicted multispecies biofilm behavior in the absence of host-microbiota perturbations.
(A) Species biomass concentrations across the thickness of the biofilm with nutrients supplied and
biomass removed at z = 0 microns. (B) Local species growth rates across the thickness of the
biofilm. (C) Acetate, butyrate, propionate, and total SCFA concentrations averaged across the biofilm.
(D) Ethanol, succinate, formate, and total OA levels averaged across the biofilm.
2.3. Glucose and Amino Acid Perturbations
Various in vivo studies have shown that glucose concentration decreases and amino acid
concentrations increase in the gut during C. difficile and other types of dysbiosis [12,61–64].
To investigate the effects of altered nutrient levels associated with host-microbiota perturbations,
we performed simulations for a 40-micron biofilm with elevated amino acid and reduced glucose
bulk concentrations (Table 1) under the assumption that C. difficile expansion is driven by these
experimentally-observed nutrient changes. While in vivo nutrient levels are impacted by diet, host
metabolism, and microbiota, this assumption was deemed reasonable given the simplified nature of
our model. Given the uncertainty associated with the bulk nutrient concentrations, we performed
a sensitivity analysis to explore their effects with respect to the species abundances (Figure S2).
This analysis was consistent with the model predictions reported below as long as the glucose to
amino acid ratio was sufficiently large. Compared to the healthy case, the local C. difficile growth
rate decreased in the bottom half of the biofilm, but increased in the top half (Figure 3A). Similar
trends were predicted for the three commensal species, which we attributed to reduced glucose, but
increased amino acid penetration into the biofilm. C. difficile is known to grow efficiently on amino
acids due to its ability to use amino acid pairs such as leucine and proline to generate ATP via Stickland
metabolism [65–67].
25
Ethanol was present at a very low level (Figure 2D) due to limited synthesis by the small E. coli
population and high consumption by the large B. thetaiotaomicron population. Of the two organic
acids (OAs) produced, formate was predicted to be present at a high level because synthesis by
F. prausnitzii and E. coli substantially exceeded consumption by C. difficile. Succinate was present
at a moderate level since it was consumed by both C. difficile and F. prausnitzii. These predictions
suggest that plentiful formate and succinate could be available to promote C. difficile propagation
under in vivo perturbations.
0
1 02 03 04 0
Location [micron]
0
0.1
0.2
0.3
Growth [hr
-1
]
A
BT
FP
EC
CD
0
1 02 03 04 0
Location [micron]
0
100
200
300
Biomass [g/L]
B
BT
FP
EC
CD
Acetate Butyrate PropionateTotal SCFA
0
10
20
30
40
Concentration [mmol/L]
C
Ethanol
SuccinateFormate Total OA
0
0.005
0.01
0.015
0.02
Concentration [mmol/L]
0
50
100
150
Concentration [mmol/L]
D
Figure 2. Predicted multispecies biofilm behavior in the absence of host-microbiota perturbations.
(A) Species biomass concentrations across the thickness of the biofilm with nutrients supplied and
biomass removed at z = 0 microns. (B) Local species growth rates across the thickness of the
biofilm. (C) Acetate, butyrate, propionate, and total SCFA concentrations averaged across the biofilm.
(D) Ethanol, succinate, formate, and total OA levels averaged across the biofilm.
2.3. Glucose and Amino Acid Perturbations
Various in vivo studies have shown that glucose concentration decreases and amino acid
concentrations increase in the gut during C. difficile and other types of dysbiosis [12,61–64].
To investigate the effects of altered nutrient levels associated with host-microbiota perturbations,
we performed simulations for a 40-micron biofilm with elevated amino acid and reduced glucose
bulk concentrations (Table 1) under the assumption that C. difficile expansion is driven by these
experimentally-observed nutrient changes. While in vivo nutrient levels are impacted by diet, host
metabolism, and microbiota, this assumption was deemed reasonable given the simplified nature of
our model. Given the uncertainty associated with the bulk nutrient concentrations, we performed
a sensitivity analysis to explore their effects with respect to the species abundances (Figure S2).
This analysis was consistent with the model predictions reported below as long as the glucose to
amino acid ratio was sufficiently large. Compared to the healthy case, the local C. difficile growth
rate decreased in the bottom half of the biofilm, but increased in the top half (Figure 3A). Similar
trends were predicted for the three commensal species, which we attributed to reduced glucose, but
increased amino acid penetration into the biofilm. C. difficile is known to grow efficiently on amino
acids due to its ability to use amino acid pairs such as leucine and proline to generate ATP via Stickland
metabolism [65–67].
25