

Processes 2018, 6,38
computational biology analysis of consortia simulations. The degree of reduction of biomass for an
average cell is approximately 4.2 or 4.8 on an NH 4
+ or N 2 basis, respectively [80]. These values can shift
due to large quantities of cellular storage polymers, such as polysaccharides or polyhydroxyalkanoates.
Additionally, biomass composition is known to shift with growth rate and culturing stress [45,81];
the provided approach can be used to create culturing condition-specific cellular growth reactions.
Altogether, the current work serves as a useful resource for the broader computational biology
community, which will enable more accurate representations of biomass synthesis and therefore
more accurate metabolism simulations.
Supplementary Materials: The following are available online at http://www.mdpi.com/2227-9717/6/5/38/s1,
File S1: A. acidocaldarius Model, File S2: A. acidocaldarius SBML, File S3: A. acidocaldarius Maintenance, File S4:
Biomass Composition, File S5: Biomass Composition Variation.
Acknowledgments: This work is a contribution of the PNNL Foundational Scientific Focus Area (Principles
of Microbial Community Design) subcontracted to Montana State University. Ashley E. Beck was supported
by the Office of the Provost at Montana State University through the Molecular Biosciences Program and NSF
(DMS-1361240). The authors would also like to thank James Folsom and Zackary Jay for helpful discussions.
Author Contributions: A.E.B. and R.P.C. conceived and designed the experiments; A.E.B. performed the
experiments; A.E.B. and K.A.H. analyzed the data; and A.E.B., K.A.H., and R.P.C. wrote the paper.
Conflicts of Interest: The authors declare no conflict of interest. The funding sponsors had no role in the design of
the study; in the collection, analyses, or interpretation of data; in the writing of the manuscript; or in the decision
to publish the results.
Appendix A
Additional data supporting method testing are provided herein.
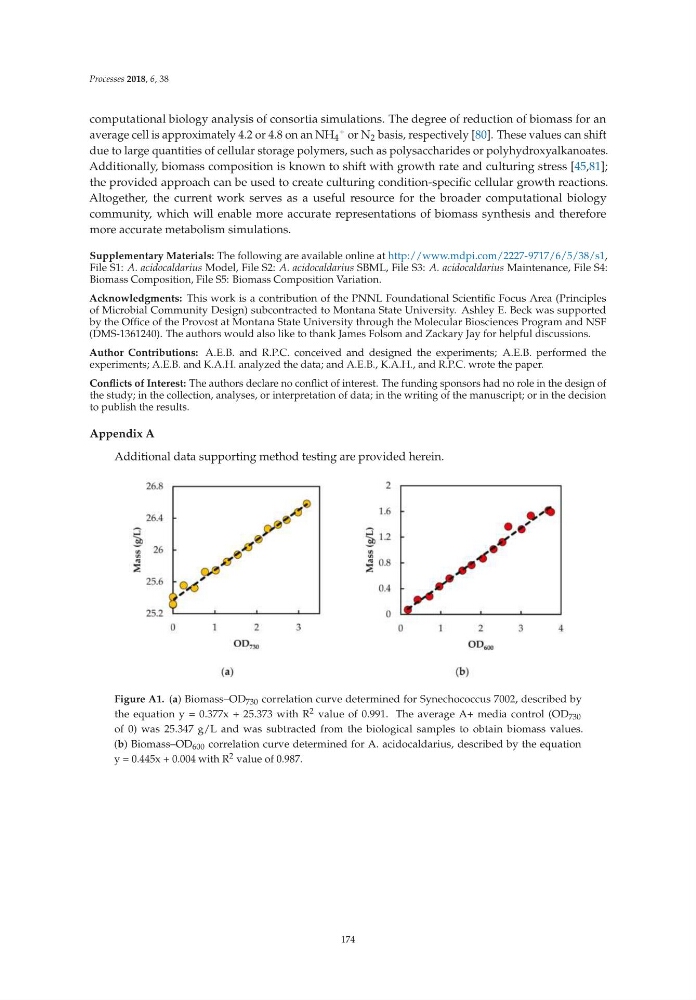
Figure A1. (a) Biomass–OD 730 correlation curve determined for Synechococcus 7002, described by
the equation y = 0.377x + 25.373 with R 2 value of 0.991. The average A+ media control (OD 730
of 0) was 25.347 g/L and was subtracted from the biological samples to obtain biomass values.
(b) Biomass–OD 600 correlation curve determined for A. acidocaldarius, described by the equation
y = 0.445x + 0.004 with R 2 value of 0.987.
174
computational biology analysis of consortia simulations. The degree of reduction of biomass for an
average cell is approximately 4.2 or 4.8 on an NH 4
+ or N 2 basis, respectively [80]. These values can shift
due to large quantities of cellular storage polymers, such as polysaccharides or polyhydroxyalkanoates.
Additionally, biomass composition is known to shift with growth rate and culturing stress [45,81];
the provided approach can be used to create culturing condition-specific cellular growth reactions.
Altogether, the current work serves as a useful resource for the broader computational biology
community, which will enable more accurate representations of biomass synthesis and therefore
more accurate metabolism simulations.
Supplementary Materials: The following are available online at http://www.mdpi.com/2227-9717/6/5/38/s1,
File S1: A. acidocaldarius Model, File S2: A. acidocaldarius SBML, File S3: A. acidocaldarius Maintenance, File S4:
Biomass Composition, File S5: Biomass Composition Variation.
Acknowledgments: This work is a contribution of the PNNL Foundational Scientific Focus Area (Principles
of Microbial Community Design) subcontracted to Montana State University. Ashley E. Beck was supported
by the Office of the Provost at Montana State University through the Molecular Biosciences Program and NSF
(DMS-1361240). The authors would also like to thank James Folsom and Zackary Jay for helpful discussions.
Author Contributions: A.E.B. and R.P.C. conceived and designed the experiments; A.E.B. performed the
experiments; A.E.B. and K.A.H. analyzed the data; and A.E.B., K.A.H., and R.P.C. wrote the paper.
Conflicts of Interest: The authors declare no conflict of interest. The funding sponsors had no role in the design of
the study; in the collection, analyses, or interpretation of data; in the writing of the manuscript; or in the decision
to publish the results.
Appendix A
Additional data supporting method testing are provided herein.
Figure A1. (a) Biomass–OD 730 correlation curve determined for Synechococcus 7002, described by
the equation y = 0.377x + 25.373 with R 2 value of 0.991. The average A+ media control (OD 730
of 0) was 25.347 g/L and was subtracted from the biological samples to obtain biomass values.
(b) Biomass–OD 600 correlation curve determined for A. acidocaldarius, described by the equation
y = 0.445x + 0.004 with R 2 value of 0.987.
174