

Processes 2018, 6,38
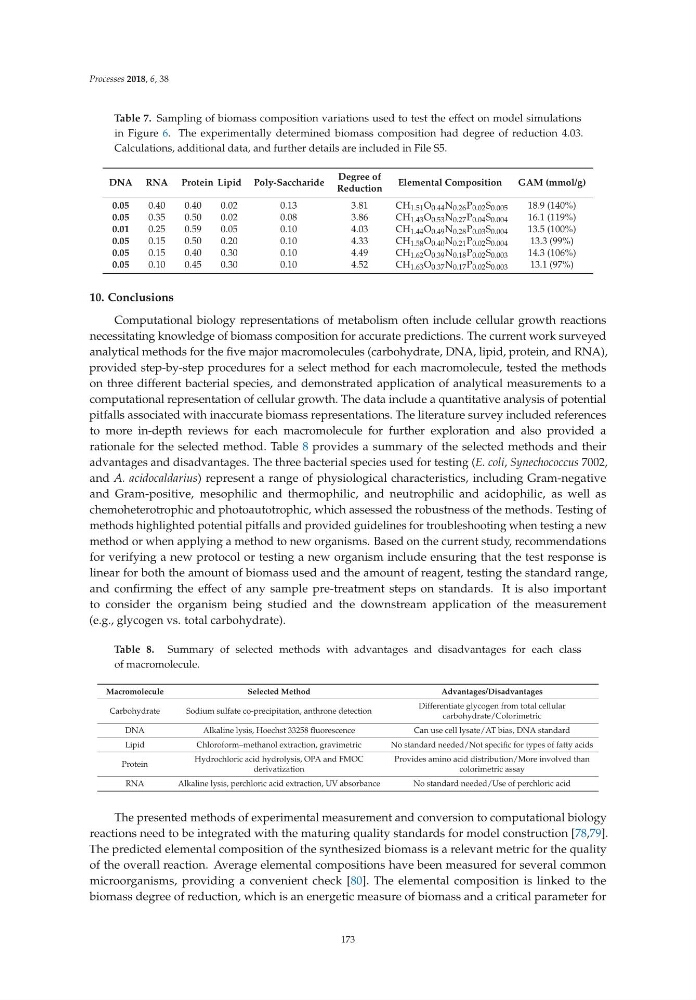
Table 7. Sampling of biomass composition variations used to test the effect on model simulations
in Figure 6. The experimentally determined biomass composition had degree of reduction 4.03.
Calculations, additional data, and further details are included in File S5.
DNA RNA Protein Lipid Poly-Saccharide
Degree of
Reduction
Elemental Composition
GAM (mmol/g)
0.05
0.40
0.40
0.02
0.13
3.81
CH 1.51 O 0.44 N 0.26 P 0.02 S 0.005
18.9 (140%)
0.05
0.35
0.50
0.02
0.08
3.86
CH 1.43 O 0.53 N 0.27 P 0.04 S 0.004
16.1 (119%)
0.01
0.25
0.59
0.05
0.10
4.03
CH 1.44 O 0.49 N 0.28 P 0.03 S 0.004
13.5 (100%)
0.05
0.15
0.50
0.20
0.10
4.33
CH 1.58 O 0.40 N 0.21 P 0.02 S 0.004
13.3 (99%)
0.05
0.15
0.40
0.30
0.10
4.49
CH 1.62 O 0.39 N 0.18 P 0.02 S 0.003
14.3 (106%)
0.05
0.10
0.45
0.30
0.10
4.52
CH 1.63 O 0.37 N 0.17 P 0.02 S 0.003
13.1 (97%)
10. Conclusions
Computational biology representations of metabolism often include cellular growth reactions
necessitating knowledge of biomass composition for accurate predictions. The current work surveyed
analytical methods for the five major macromolecules (carbohydrate, DNA, lipid, protein, and RNA),
provided step-by-step procedures for a select method for each macromolecule, tested the methods
on three different bacterial species, and demonstrated application of analytical measurements to a
computational representation of cellular growth. The data include a quantitative analysis of potential
pitfalls associated with inaccurate biomass representations. The literature survey included references
to more in-depth reviews for each macromolecule for further exploration and also provided a
rationale for the selected method. Table 8 provides a summary of the selected methods and their
advantages and disadvantages. The three bacterial species used for testing (E. coli, Synechococcus 7002,
and A. acidocaldarius) represent a range of physiological characteristics, including Gram-negative
and Gram-positive, mesophilic and thermophilic, and neutrophilic and acidophilic, as well as
chemoheterotrophic and photoautotrophic, which assessed the robustness of the methods. Testing of
methods highlighted potential pitfalls and provided guidelines for troubleshooting when testing a new
method or when applying a method to new organisms. Based on the current study, recommendations
for verifying a new protocol or testing a new organism include ensuring that the test response is
linear for both the amount of biomass used and the amount of reagent, testing the standard range,
and confirming the effect of any sample pre-treatment steps on standards. It is also important
to consider the organism being studied and the downstream application of the measurement
(e.g., glycogen vs. total carbohydrate).
Table 8. Summary of selected methods with advantages and disadvantages for each class
of macromolecule.
Macromolecule
Selected Method
Advantages/Disadvantages
Carbohydrate
Sodium sulfate co-precipitation, anthrone detection
Differentiate glycogen from total cellular
carbohydrate/Colorimetric
DNA
Alkaline lysis, Hoechst 33258 fluorescence
Can use cell lysate/AT bias, DNA standard
Lipid
Chloroform–methanol extraction, gravimetric
No standard needed/Not specific for types of fatty acids
Protein
Hydrochloric acid hydrolysis, OPA and FMOC
derivatization
Provides amino acid distribution/More involved than
colorimetric assay
RNA
Alkaline lysis, perchloric acid extraction, UV absorbance
No standard needed/Use of perchloric acid
The presented methods of experimental measurement and conversion to computational biology
reactions need to be integrated with the maturing quality standards for model construction [78,79].
The predicted elemental composition of the synthesized biomass is a relevant metric for the quality
of the overall reaction. Average elemental compositions have been measured for several common
microorganisms, providing a convenient check [80]. The elemental composition is linked to the
biomass degree of reduction, which is an energetic measure of biomass and a critical parameter for
173
Table 7. Sampling of biomass composition variations used to test the effect on model simulations
in Figure 6. The experimentally determined biomass composition had degree of reduction 4.03.
Calculations, additional data, and further details are included in File S5.
DNA RNA Protein Lipid Poly-Saccharide
Degree of
Reduction
Elemental Composition
GAM (mmol/g)
0.05
0.40
0.40
0.02
0.13
3.81
CH 1.51 O 0.44 N 0.26 P 0.02 S 0.005
18.9 (140%)
0.05
0.35
0.50
0.02
0.08
3.86
CH 1.43 O 0.53 N 0.27 P 0.04 S 0.004
16.1 (119%)
0.01
0.25
0.59
0.05
0.10
4.03
CH 1.44 O 0.49 N 0.28 P 0.03 S 0.004
13.5 (100%)
0.05
0.15
0.50
0.20
0.10
4.33
CH 1.58 O 0.40 N 0.21 P 0.02 S 0.004
13.3 (99%)
0.05
0.15
0.40
0.30
0.10
4.49
CH 1.62 O 0.39 N 0.18 P 0.02 S 0.003
14.3 (106%)
0.05
0.10
0.45
0.30
0.10
4.52
CH 1.63 O 0.37 N 0.17 P 0.02 S 0.003
13.1 (97%)
10. Conclusions
Computational biology representations of metabolism often include cellular growth reactions
necessitating knowledge of biomass composition for accurate predictions. The current work surveyed
analytical methods for the five major macromolecules (carbohydrate, DNA, lipid, protein, and RNA),
provided step-by-step procedures for a select method for each macromolecule, tested the methods
on three different bacterial species, and demonstrated application of analytical measurements to a
computational representation of cellular growth. The data include a quantitative analysis of potential
pitfalls associated with inaccurate biomass representations. The literature survey included references
to more in-depth reviews for each macromolecule for further exploration and also provided a
rationale for the selected method. Table 8 provides a summary of the selected methods and their
advantages and disadvantages. The three bacterial species used for testing (E. coli, Synechococcus 7002,
and A. acidocaldarius) represent a range of physiological characteristics, including Gram-negative
and Gram-positive, mesophilic and thermophilic, and neutrophilic and acidophilic, as well as
chemoheterotrophic and photoautotrophic, which assessed the robustness of the methods. Testing of
methods highlighted potential pitfalls and provided guidelines for troubleshooting when testing a new
method or when applying a method to new organisms. Based on the current study, recommendations
for verifying a new protocol or testing a new organism include ensuring that the test response is
linear for both the amount of biomass used and the amount of reagent, testing the standard range,
and confirming the effect of any sample pre-treatment steps on standards. It is also important
to consider the organism being studied and the downstream application of the measurement
(e.g., glycogen vs. total carbohydrate).
Table 8. Summary of selected methods with advantages and disadvantages for each class
of macromolecule.
Macromolecule
Selected Method
Advantages/Disadvantages
Carbohydrate
Sodium sulfate co-precipitation, anthrone detection
Differentiate glycogen from total cellular
carbohydrate/Colorimetric
DNA
Alkaline lysis, Hoechst 33258 fluorescence
Can use cell lysate/AT bias, DNA standard
Lipid
Chloroform–methanol extraction, gravimetric
No standard needed/Not specific for types of fatty acids
Protein
Hydrochloric acid hydrolysis, OPA and FMOC
derivatization
Provides amino acid distribution/More involved than
colorimetric assay
RNA
Alkaline lysis, perchloric acid extraction, UV absorbance
No standard needed/Use of perchloric acid
The presented methods of experimental measurement and conversion to computational biology
reactions need to be integrated with the maturing quality standards for model construction [78,79].
The predicted elemental composition of the synthesized biomass is a relevant metric for the quality
of the overall reaction. Average elemental compositions have been measured for several common
microorganisms, providing a convenient check [80]. The elemental composition is linked to the
biomass degree of reduction, which is an energetic measure of biomass and a critical parameter for
173