

Processes 2018, 6,38
were generated and tested in addition to the experimentally measured composition (see File S5).
The optimal in silico biomass yield on electron donor (glucose) and associated biomass yield on
electron acceptor (oxygen) was determined for each biomass composition. A sampling of the data is
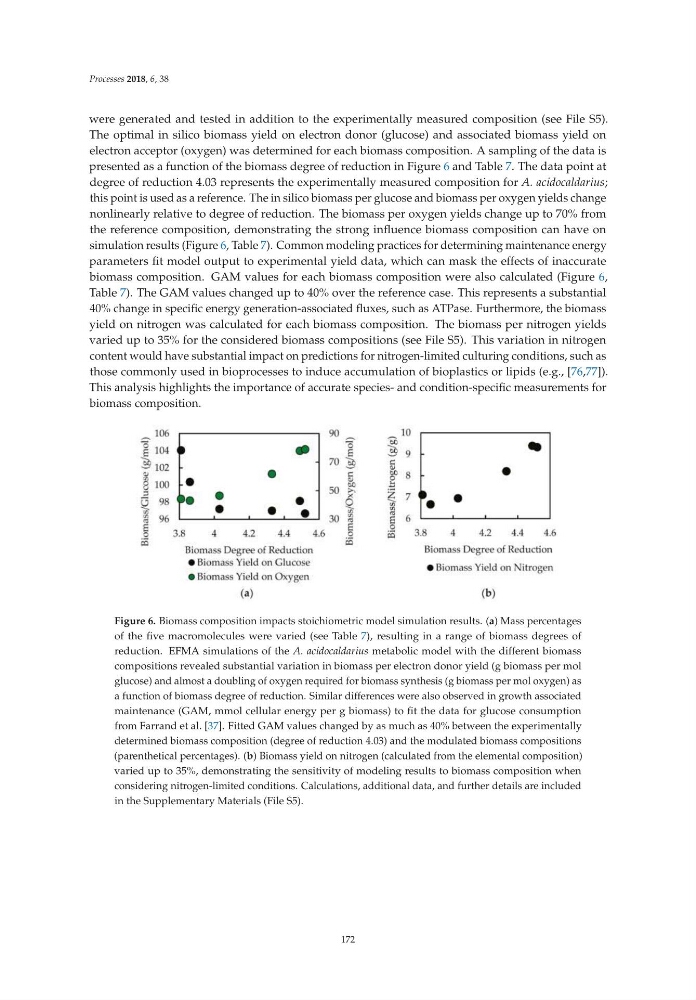
presented as a function of the biomass degree of reduction in Figure 6 and Table 7. The data point at
degree of reduction 4.03 represents the experimentally measured composition for A. acidocaldarius;
this point is used as a reference. The in silico biomass per glucose and biomass per oxygen yields change
nonlinearly relative to degree of reduction. The biomass per oxygen yields change up to 70% from
the reference composition, demonstrating the strong influence biomass composition can have on
simulation results (Figure 6, Table 7). Common modeling practices for determining maintenance energy
parameters fit model output to experimental yield data, which can mask the effects of inaccurate
biomass composition. GAM values for each biomass composition were also calculated (Figure 6,
Table 7). The GAM values changed up to 40% over the reference case. This represents a substantial
40% change in specific energy generation-associated fluxes, such as ATPase. Furthermore, the biomass
yield on nitrogen was calculated for each biomass composition. The biomass per nitrogen yields
varied up to 35% for the considered biomass compositions (see File S5). This variation in nitrogen
content would have substantial impact on predictions for nitrogen-limited culturing conditions, such as
those commonly used in bioprocesses to induce accumulation of bioplastics or lipids (e.g., [76,77]).
This analysis highlights the importance of accurate species- and condition-specific measurements for
biomass composition.
Figure 6. Biomass composition impacts stoichiometric model simulation results. (a) Mass percentages
of the five macromolecules were varied (see Table 7), resulting in a range of biomass degrees of
reduction. EFMA simulations of the A. acidocaldarius metabolic model with the different biomass
compositions revealed substantial variation in biomass per electron donor yield (g biomass per mol
glucose) and almost a doubling of oxygen required for biomass synthesis (g biomass per mol oxygen) as
a function of biomass degree of reduction. Similar differences were also observed in growth associated
maintenance (GAM, mmol cellular energy per g biomass) to fit the data for glucose consumption
from Farrand et al. [37]. Fitted GAM values changed by as much as 40% between the experimentally
determined biomass composition (degree of reduction 4.03) and the modulated biomass compositions
(parenthetical percentages). (b) Biomass yield on nitrogen (calculated from the elemental composition)
varied up to 35%, demonstrating the sensitivity of modeling results to biomass composition when
considering nitrogen-limited conditions. Calculations, additional data, and further details are included
in the Supplementary Materials (File S5).
172
were generated and tested in addition to the experimentally measured composition (see File S5).
The optimal in silico biomass yield on electron donor (glucose) and associated biomass yield on
electron acceptor (oxygen) was determined for each biomass composition. A sampling of the data is
presented as a function of the biomass degree of reduction in Figure 6 and Table 7. The data point at
degree of reduction 4.03 represents the experimentally measured composition for A. acidocaldarius;
this point is used as a reference. The in silico biomass per glucose and biomass per oxygen yields change
nonlinearly relative to degree of reduction. The biomass per oxygen yields change up to 70% from
the reference composition, demonstrating the strong influence biomass composition can have on
simulation results (Figure 6, Table 7). Common modeling practices for determining maintenance energy
parameters fit model output to experimental yield data, which can mask the effects of inaccurate
biomass composition. GAM values for each biomass composition were also calculated (Figure 6,
Table 7). The GAM values changed up to 40% over the reference case. This represents a substantial
40% change in specific energy generation-associated fluxes, such as ATPase. Furthermore, the biomass
yield on nitrogen was calculated for each biomass composition. The biomass per nitrogen yields
varied up to 35% for the considered biomass compositions (see File S5). This variation in nitrogen
content would have substantial impact on predictions for nitrogen-limited culturing conditions, such as
those commonly used in bioprocesses to induce accumulation of bioplastics or lipids (e.g., [76,77]).
This analysis highlights the importance of accurate species- and condition-specific measurements for
biomass composition.
Figure 6. Biomass composition impacts stoichiometric model simulation results. (a) Mass percentages
of the five macromolecules were varied (see Table 7), resulting in a range of biomass degrees of
reduction. EFMA simulations of the A. acidocaldarius metabolic model with the different biomass
compositions revealed substantial variation in biomass per electron donor yield (g biomass per mol
glucose) and almost a doubling of oxygen required for biomass synthesis (g biomass per mol oxygen) as
a function of biomass degree of reduction. Similar differences were also observed in growth associated
maintenance (GAM, mmol cellular energy per g biomass) to fit the data for glucose consumption
from Farrand et al. [37]. Fitted GAM values changed by as much as 40% between the experimentally
determined biomass composition (degree of reduction 4.03) and the modulated biomass compositions
(parenthetical percentages). (b) Biomass yield on nitrogen (calculated from the elemental composition)
varied up to 35%, demonstrating the sensitivity of modeling results to biomass composition when
considering nitrogen-limited conditions. Calculations, additional data, and further details are included
in the Supplementary Materials (File S5).
172