

Processes 2018, 6,38
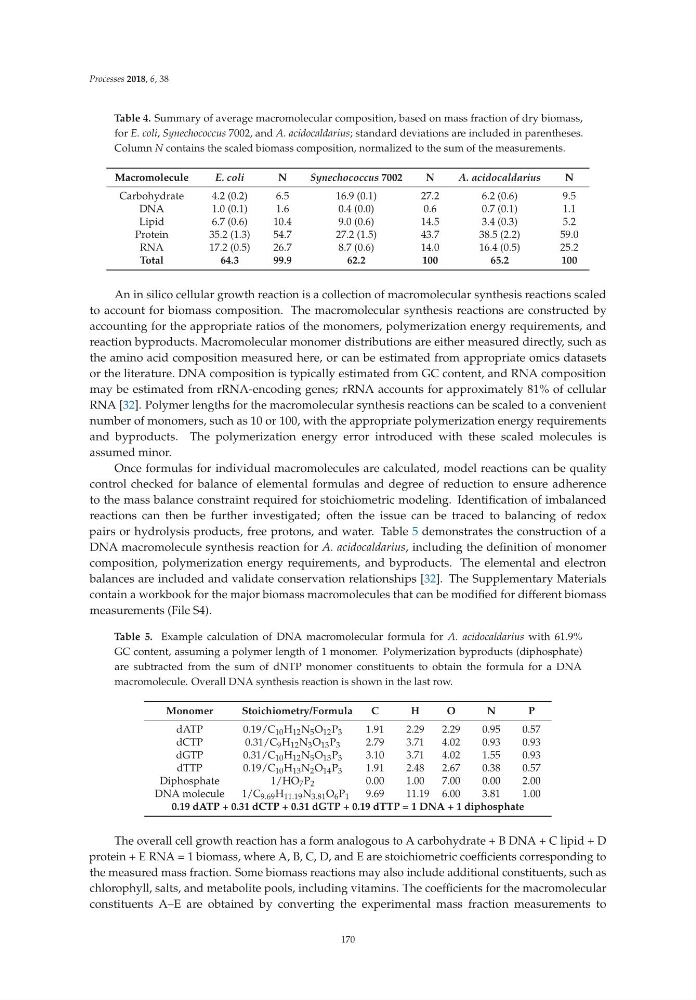
Table 4. Summary of average macromolecular composition, based on mass fraction of dry biomass,
for E. coli, Synechococcus 7002, and A. acidocaldarius; standard deviations are included in parentheses.
Column N contains the scaled biomass composition, normalized to the sum of the measurements.
Macromolecule
E. coli
N
Synechococcus 7002
N
A. acidocaldarius
N
Carbohydrate
4.2 (0.2)
6.5
16.9 (0.1)
27.2
6.2 (0.6)
9.5
DNA
1.0 (0.1)
1.6
0.4 (0.0)
0.6
0.7 (0.1)
1.1
Lipid
6.7 (0.6)
10.4
9.0 (0.6)
14.5
3.4 (0.3)
5.2
Protein
35.2 (1.3)
54.7
27.2 (1.5)
43.7
38.5 (2.2)
59.0
RNA
17.2 (0.5)
26.7
8.7 (0.6)
14.0
16.4 (0.5)
25.2
Total
64.3
99.9
62.2
100
65.2
100
An in silico cellular growth reaction is a collection of macromolecular synthesis reactions scaled
to account for biomass composition. The macromolecular synthesis reactions are constructed by
accounting for the appropriate ratios of the monomers, polymerization energy requirements, and
reaction byproducts. Macromolecular monomer distributions are either measured directly, such as
the amino acid composition measured here, or can be estimated from appropriate omics datasets
or the literature. DNA composition is typically estimated from GC content, and RNA composition
may be estimated from rRNA-encoding genes; rRNA accounts for approximately 81% of cellular
RNA [32]. Polymer lengths for the macromolecular synthesis reactions can be scaled to a convenient
number of monomers, such as 10 or 100, with the appropriate polymerization energy requirements
and byproducts. The polymerization energy error introduced with these scaled molecules is
assumed minor.
Once formulas for individual macromolecules are calculated, model reactions can be quality
control checked for balance of elemental formulas and degree of reduction to ensure adherence
to the mass balance constraint required for stoichiometric modeling. Identification of imbalanced
reactions can then be further investigated; often the issue can be traced to balancing of redox
pairs or hydrolysis products, free protons, and water. Table 5 demonstrates the construction of a
DNA macromolecule synthesis reaction for A. acidocaldarius, including the definition of monomer
composition, polymerization energy requirements, and byproducts. The elemental and electron
balances are included and validate conservation relationships [32]. The Supplementary Materials
contain a workbook for the major biomass macromolecules that can be modified for different biomass
measurements (File S4).
Table 5. Example calculation of DNA macromolecular formula for A. acidocaldarius with 61.9%
GC content, assuming a polymer length of 1 monomer. Polymerization byproducts (diphosphate)
are subtracted from the sum of dNTP monomer constituents to obtain the formula for a DNA
macromolecule. Overall DNA synthesis reaction is shown in the last row.
Monomer
Stoichiometry/Formula
C
H
O
N
P
dATP
0.19/C 10 H 12 N 5 O 12 P 3
1.91
2.29
2.29
0.95
0.57
dCTP
0.31/C 9 H 12 N 3 O 13 P 3
2.79
3.71
4.02
0.93
0.93
dGTP
0.31/C 10 H 12 N 5 O 13 P 3
3.10
3.71
4.02
1.55
0.93
dTTP
0.19/C 10 H 13 N 2 O 14 P 3
1.91
2.48
2.67
0.38
0.57
Diphosphate
1/HO 7 P 2
0.00
1.00
7.00
0.00
2.00
DNA molecule
1/C 9.69 H 11.19 N 3.81 O 6 P 1
9.69
11.19 6.00
3.81
1.00
0.19 dATP + 0.31 dCTP + 0.31 dGTP + 0.19 dTTP = 1 DNA + 1 diphosphate
The overall cell growth reaction has a form analogous to A carbohydrate + B DNA + C lipid + D
protein + E RNA = 1 biomass, where A, B, C, D, and E are stoichiometric coefficients corresponding to
the measured mass fraction. Some biomass reactions may also include additional constituents, such as
chlorophyll, salts, and metabolite pools, including vitamins. The coefficients for the macromolecular
constituents A–E are obtained by converting the experimental mass fraction measurements to
170
Table 4. Summary of average macromolecular composition, based on mass fraction of dry biomass,
for E. coli, Synechococcus 7002, and A. acidocaldarius; standard deviations are included in parentheses.
Column N contains the scaled biomass composition, normalized to the sum of the measurements.
Macromolecule
E. coli
N
Synechococcus 7002
N
A. acidocaldarius
N
Carbohydrate
4.2 (0.2)
6.5
16.9 (0.1)
27.2
6.2 (0.6)
9.5
DNA
1.0 (0.1)
1.6
0.4 (0.0)
0.6
0.7 (0.1)
1.1
Lipid
6.7 (0.6)
10.4
9.0 (0.6)
14.5
3.4 (0.3)
5.2
Protein
35.2 (1.3)
54.7
27.2 (1.5)
43.7
38.5 (2.2)
59.0
RNA
17.2 (0.5)
26.7
8.7 (0.6)
14.0
16.4 (0.5)
25.2
Total
64.3
99.9
62.2
100
65.2
100
An in silico cellular growth reaction is a collection of macromolecular synthesis reactions scaled
to account for biomass composition. The macromolecular synthesis reactions are constructed by
accounting for the appropriate ratios of the monomers, polymerization energy requirements, and
reaction byproducts. Macromolecular monomer distributions are either measured directly, such as
the amino acid composition measured here, or can be estimated from appropriate omics datasets
or the literature. DNA composition is typically estimated from GC content, and RNA composition
may be estimated from rRNA-encoding genes; rRNA accounts for approximately 81% of cellular
RNA [32]. Polymer lengths for the macromolecular synthesis reactions can be scaled to a convenient
number of monomers, such as 10 or 100, with the appropriate polymerization energy requirements
and byproducts. The polymerization energy error introduced with these scaled molecules is
assumed minor.
Once formulas for individual macromolecules are calculated, model reactions can be quality
control checked for balance of elemental formulas and degree of reduction to ensure adherence
to the mass balance constraint required for stoichiometric modeling. Identification of imbalanced
reactions can then be further investigated; often the issue can be traced to balancing of redox
pairs or hydrolysis products, free protons, and water. Table 5 demonstrates the construction of a
DNA macromolecule synthesis reaction for A. acidocaldarius, including the definition of monomer
composition, polymerization energy requirements, and byproducts. The elemental and electron
balances are included and validate conservation relationships [32]. The Supplementary Materials
contain a workbook for the major biomass macromolecules that can be modified for different biomass
measurements (File S4).
Table 5. Example calculation of DNA macromolecular formula for A. acidocaldarius with 61.9%
GC content, assuming a polymer length of 1 monomer. Polymerization byproducts (diphosphate)
are subtracted from the sum of dNTP monomer constituents to obtain the formula for a DNA
macromolecule. Overall DNA synthesis reaction is shown in the last row.
Monomer
Stoichiometry/Formula
C
H
O
N
P
dATP
0.19/C 10 H 12 N 5 O 12 P 3
1.91
2.29
2.29
0.95
0.57
dCTP
0.31/C 9 H 12 N 3 O 13 P 3
2.79
3.71
4.02
0.93
0.93
dGTP
0.31/C 10 H 12 N 5 O 13 P 3
3.10
3.71
4.02
1.55
0.93
dTTP
0.19/C 10 H 13 N 2 O 14 P 3
1.91
2.48
2.67
0.38
0.57
Diphosphate
1/HO 7 P 2
0.00
1.00
7.00
0.00
2.00
DNA molecule
1/C 9.69 H 11.19 N 3.81 O 6 P 1
9.69
11.19 6.00
3.81
1.00
0.19 dATP + 0.31 dCTP + 0.31 dGTP + 0.19 dTTP = 1 DNA + 1 diphosphate
The overall cell growth reaction has a form analogous to A carbohydrate + B DNA + C lipid + D
protein + E RNA = 1 biomass, where A, B, C, D, and E are stoichiometric coefficients corresponding to
the measured mass fraction. Some biomass reactions may also include additional constituents, such as
chlorophyll, salts, and metabolite pools, including vitamins. The coefficients for the macromolecular
constituents A–E are obtained by converting the experimental mass fraction measurements to
170