

Processes 2018, 6,38
with concentrated hydrochloric acid). Linearity of the spectrophotometer within the range of sample
absorbance should be confirmed by successively diluting the sample with 0.5 M HClO 4 and confirming
a linear fit to the resulting absorbance measurements. Absorbance at 280 nm can also be measured,
and the A 260 /A 280 can be calculated to assess RNA purity.
8.3. Test Results
Benthin et al. [67] recommended using a quantity of biomass corresponding to ~0.4 mg of
RNA. ~2 mg and ~8 mg biomass was used for E. coli and Synechococcus 7002, respectively, based on
previous estimates of RNA content [32,46]. Correlation between biomass and RNA content was
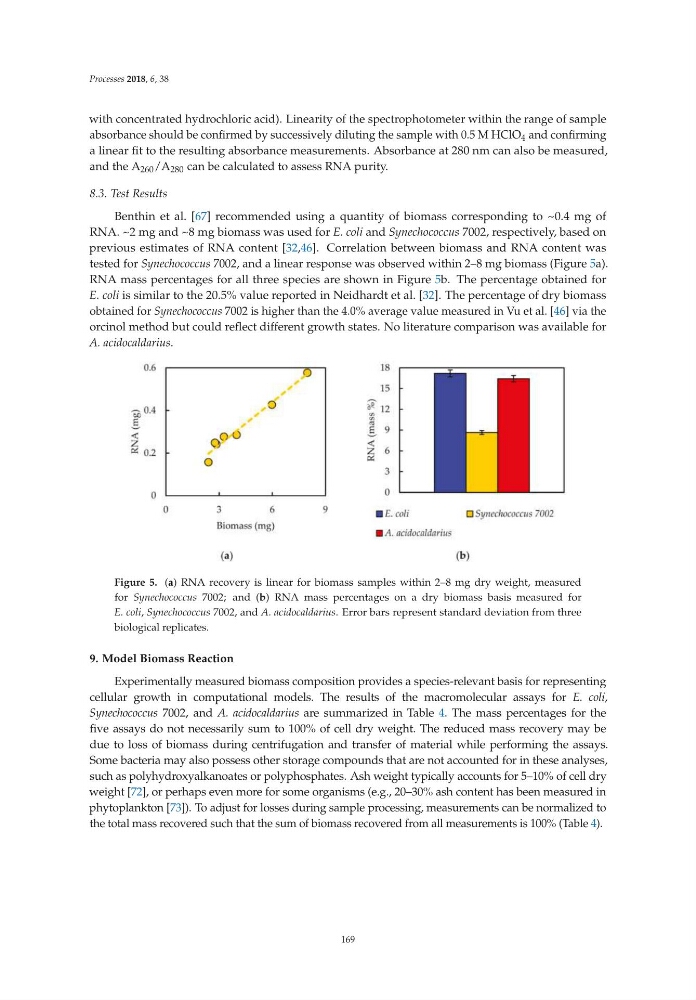
tested for Synechococcus 7002, and a linear response was observed within 2–8 mg biomass (Figure 5a).
RNA mass percentages for all three species are shown in Figure 5b. The percentage obtained for
E. coli is similar to the 20.5% value reported in Neidhardt et al. [32]. The percentage of dry biomass
obtained for Synechococcus 7002 is higher than the 4.0% average value measured in Vu et al. [46] via the
orcinol method but could reflect different growth states. No literature comparison was available for
A. acidocaldarius.
Figure 5. (a) RNA recovery is linear for biomass samples within 2–8 mg dry weight, measured
for Synechococcus 7002; and (b) RNA mass percentages on a dry biomass basis measured for
E. coli, Synechococcus 7002, and A. acidocaldarius. Error bars represent standard deviation from three
biological replicates.
9. Model Biomass Reaction
Experimentally measured biomass composition provides a species-relevant basis for representing
cellular growth in computational models. The results of the macromolecular assays for E. coli,
Synechococcus 7002, and A. acidocaldarius are summarized in Table 4. The mass percentages for the
five assays do not necessarily sum to 100% of cell dry weight. The reduced mass recovery may be
due to loss of biomass during centrifugation and transfer of material while performing the assays.
Some bacteria may also possess other storage compounds that are not accounted for in these analyses,
such as polyhydroxyalkanoates or polyphosphates. Ash weight typically accounts for 5–10% of cell dry
weight [72], or perhaps even more for some organisms (e.g., 20–30% ash content has been measured in
phytoplankton [73]). To adjust for losses during sample processing, measurements can be normalized to
the total mass recovered such that the sum of biomass recovered from all measurements is 100% (Table 4).
169
with concentrated hydrochloric acid). Linearity of the spectrophotometer within the range of sample
absorbance should be confirmed by successively diluting the sample with 0.5 M HClO 4 and confirming
a linear fit to the resulting absorbance measurements. Absorbance at 280 nm can also be measured,
and the A 260 /A 280 can be calculated to assess RNA purity.
8.3. Test Results
Benthin et al. [67] recommended using a quantity of biomass corresponding to ~0.4 mg of
RNA. ~2 mg and ~8 mg biomass was used for E. coli and Synechococcus 7002, respectively, based on
previous estimates of RNA content [32,46]. Correlation between biomass and RNA content was
tested for Synechococcus 7002, and a linear response was observed within 2–8 mg biomass (Figure 5a).
RNA mass percentages for all three species are shown in Figure 5b. The percentage obtained for
E. coli is similar to the 20.5% value reported in Neidhardt et al. [32]. The percentage of dry biomass
obtained for Synechococcus 7002 is higher than the 4.0% average value measured in Vu et al. [46] via the
orcinol method but could reflect different growth states. No literature comparison was available for
A. acidocaldarius.
Figure 5. (a) RNA recovery is linear for biomass samples within 2–8 mg dry weight, measured
for Synechococcus 7002; and (b) RNA mass percentages on a dry biomass basis measured for
E. coli, Synechococcus 7002, and A. acidocaldarius. Error bars represent standard deviation from three
biological replicates.
9. Model Biomass Reaction
Experimentally measured biomass composition provides a species-relevant basis for representing
cellular growth in computational models. The results of the macromolecular assays for E. coli,
Synechococcus 7002, and A. acidocaldarius are summarized in Table 4. The mass percentages for the
five assays do not necessarily sum to 100% of cell dry weight. The reduced mass recovery may be
due to loss of biomass during centrifugation and transfer of material while performing the assays.
Some bacteria may also possess other storage compounds that are not accounted for in these analyses,
such as polyhydroxyalkanoates or polyphosphates. Ash weight typically accounts for 5–10% of cell dry
weight [72], or perhaps even more for some organisms (e.g., 20–30% ash content has been measured in
phytoplankton [73]). To adjust for losses during sample processing, measurements can be normalized to
the total mass recovered such that the sum of biomass recovered from all measurements is 100% (Table 4).
169