

3
Haddadi et al. - Growth and assessment parameters of Calappa granulata in Algerian coast
S1 and S2 are variables used to calculate the probability of
capture under the logistic model. PL : Probability of capture
for length Lc.
RESULTS
Results reported on table 1 were calculated based on the
aforementioned collected specimens of C. granulata. The
results show that the calculated value of Student test for the two
length averages (males and females) of this species ε = 0.28
is lower than the value provided by Student’s table εt = 1.96
at a risk rate α of 5%. This means that there is no significant
difference between the length averages of the two sexes. In the
rest of this study, the data for both sexes will be treated in the
same analysis.
Length-weight relationship
As illustrated in figure 4, after the use of the ‘power’ type
trend curve, the parameters obtained for C. granulata are:
a = 0.0058 ; b = 2.41 with a correlation coefficient r = 0.85.
In order to see the growth type of this species, ‘t’ test (Schwartz,
1992) was performed, and the results are represented in table 2.
Figure 4. C. granulata length-weight relationship (Power-type trendline).
TW : Total weight ; CL : Cephalothoracic length.
The tcalculated for C. granulata is 8.7 (Tab. 2), this value is
higher than the one provided by the test table. This indicates
that the growth of this species follows a negative allometry
type, in other words, the weight grows at a low rate compared
to the cube of the length.
Table 2. Estimated length-weight relationship parameters for C.
granulata.
Parameters
n
a
b
r²
t cal
α
Values
233 0.0058 2.41 0.85 8.70 0.05
Growth parameters
In order to obtain the value of the starting length and the
starting sample, L∞ calculated by the Powell-Wetherall
method (99.55mm) was introduced into the program
ELEFAN I - “K-scan label”. The results presented on the
K-scan label and the Equal Responses Surface subroutine
are in table 3.
Table 1. Student test for males and females of C. granulata species.
♀/♂
Mean (mm)
Var.
N
ε
Α
♂
65.1
102.86
84
0.28
0.05
♀
65.2
75.02
149
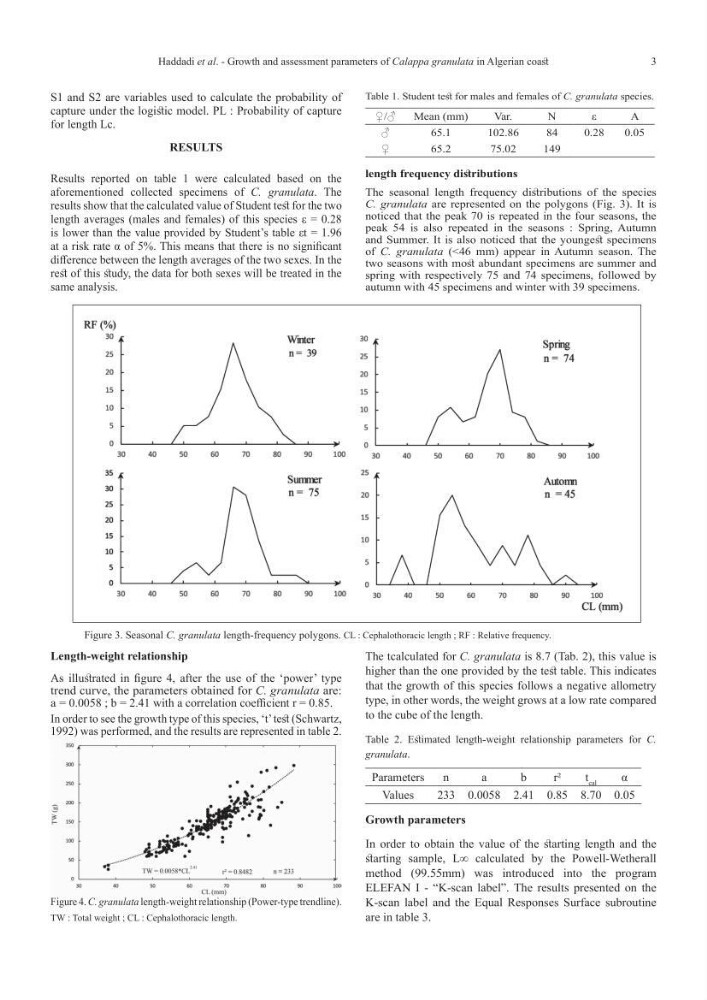
length frequency distributions
The seasonal length frequency distributions of the species
C. granulata are represented on the polygons (Fig. 3). It is
noticed that the peak 70 is repeated in the four seasons, the
peak 54 is also repeated in the seasons : Spring, Autumn
and Summer. It is also noticed that the youngest specimens
of C. granulata (<46 mm) appear in Autumn season. The
two seasons with most abundant specimens are summer and
spring with respectively 75 and 74 specimens, followed by
autumn with 45 specimens and winter with 39 specimens.
Figure 3. Seasonal C. granulata length-frequency polygons. CL : Cephalothoracic length ; RF : Relative frequency.
Haddadi et al. - Growth and assessment parameters of Calappa granulata in Algerian coast
S1 and S2 are variables used to calculate the probability of
capture under the logistic model. PL : Probability of capture
for length Lc.
RESULTS
Results reported on table 1 were calculated based on the
aforementioned collected specimens of C. granulata. The
results show that the calculated value of Student test for the two
length averages (males and females) of this species ε = 0.28
is lower than the value provided by Student’s table εt = 1.96
at a risk rate α of 5%. This means that there is no significant
difference between the length averages of the two sexes. In the
rest of this study, the data for both sexes will be treated in the
same analysis.
Length-weight relationship
As illustrated in figure 4, after the use of the ‘power’ type
trend curve, the parameters obtained for C. granulata are:
a = 0.0058 ; b = 2.41 with a correlation coefficient r = 0.85.
In order to see the growth type of this species, ‘t’ test (Schwartz,
1992) was performed, and the results are represented in table 2.
Figure 4. C. granulata length-weight relationship (Power-type trendline).
TW : Total weight ; CL : Cephalothoracic length.
The tcalculated for C. granulata is 8.7 (Tab. 2), this value is
higher than the one provided by the test table. This indicates
that the growth of this species follows a negative allometry
type, in other words, the weight grows at a low rate compared
to the cube of the length.
Table 2. Estimated length-weight relationship parameters for C.
granulata.
Parameters
n
a
b
r²
t cal
α
Values
233 0.0058 2.41 0.85 8.70 0.05
Growth parameters
In order to obtain the value of the starting length and the
starting sample, L∞ calculated by the Powell-Wetherall
method (99.55mm) was introduced into the program
ELEFAN I - “K-scan label”. The results presented on the
K-scan label and the Equal Responses Surface subroutine
are in table 3.
Table 1. Student test for males and females of C. granulata species.
♀/♂
Mean (mm)
Var.
N
ε
Α
♂
65.1
102.86
84
0.28
0.05
♀
65.2
75.02
149
length frequency distributions
The seasonal length frequency distributions of the species
C. granulata are represented on the polygons (Fig. 3). It is
noticed that the peak 70 is repeated in the four seasons, the
peak 54 is also repeated in the seasons : Spring, Autumn
and Summer. It is also noticed that the youngest specimens
of C. granulata (<46 mm) appear in Autumn season. The
two seasons with most abundant specimens are summer and
spring with respectively 75 and 74 specimens, followed by
autumn with 45 specimens and winter with 39 specimens.
Figure 3. Seasonal C. granulata length-frequency polygons. CL : Cephalothoracic length ; RF : Relative frequency.