

Environ Monit Assess
(2021) 193:333
1 3
Page 5 of 12 333
p < 0.05). However, all measured parameters showed
a significant difference on a time scale (p < 0.05).
Ostreopsis sp. abundances and environmental factors
affecting its proliferation in the fish farm
In the fish ponds (St.3), Ostreopsis cells were not
observed during the entire monitoring period. However, Ostreopsis cell abundance showed a monthly
pattern in input and output water of sea bream farm
(Figs. 6 and 7). The highest abundance of Ostreopsis
sp. was observed in August 2016 both for input and
output water (600 and 6340 cells L
−1
, respectively),
while they were lower or not present in June and September. The peak in summer 2017 was recorded in
early August in the output station (St.2) with a density of 4895 cells L
−1
. The peak of summer 2016
coincides with a temperature of 28.4 °C, salinity
38.3 PSU, DIN, and PO 4 = 0.60 and 0.08 μmol L
−1
,
respectively, BOD = 35 mg L
−1
and chlorophylla = 2.99 μg L
−1
. Environmental parameters recorded
when the second peak occurred in 2017 were as
follows: the temperature = 28.6 °C, salinity = 38.4
PSU, DIN, and PO 4 = 0.61 and 0.13 μmol L
−1
,
BOD = 36 mg L
−1
, and chlorophyll-a = 2.36 μg L
−1
.
The cell abundance in the input water was positively and significantly correlated (R
2
= 0.91,
p < 0.001) with the cell abundance in the output
water. The abiotic factors (temperature, salinity,
DIN, PO 4 , BOD, and chlorophyll-a) in relation with
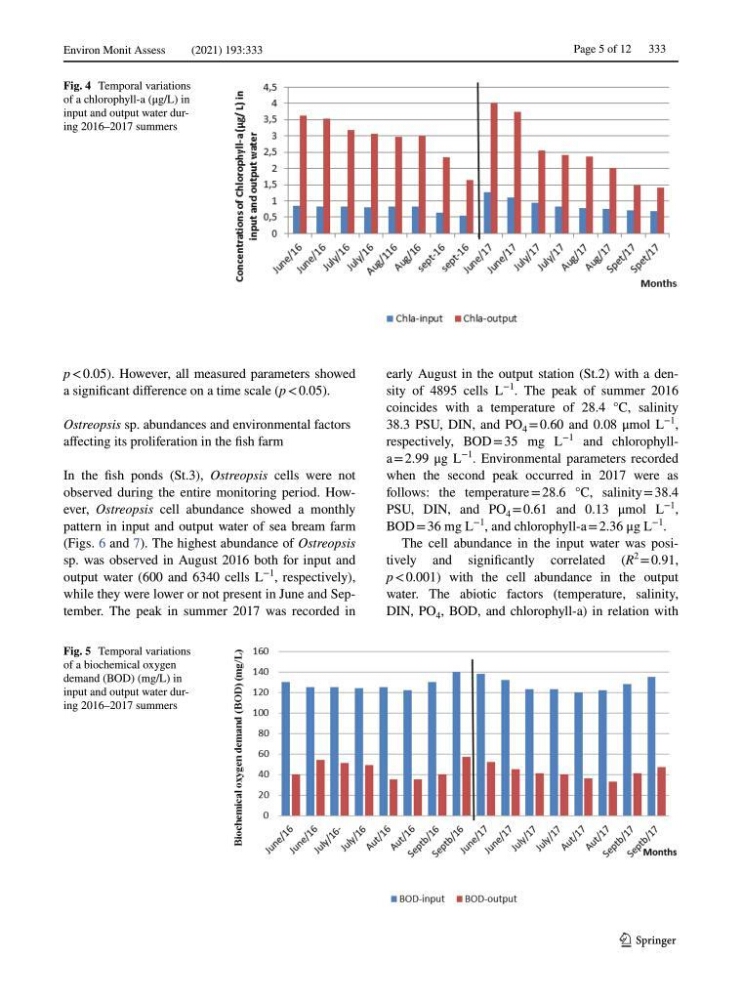
Fig. 4 Temporal variations
of a chlorophyll-a (μg/L) in
input and output water during 2016–2017 summers
Fig. 5 Temporal variations
of a biochemical oxygen
demand (BOD) (mg/L) in
input and output water during 2016–2017 summers
(2021) 193:333
1 3
Page 5 of 12 333
p < 0.05). However, all measured parameters showed
a significant difference on a time scale (p < 0.05).
Ostreopsis sp. abundances and environmental factors
affecting its proliferation in the fish farm
In the fish ponds (St.3), Ostreopsis cells were not
observed during the entire monitoring period. However, Ostreopsis cell abundance showed a monthly
pattern in input and output water of sea bream farm
(Figs. 6 and 7). The highest abundance of Ostreopsis
sp. was observed in August 2016 both for input and
output water (600 and 6340 cells L
−1
, respectively),
while they were lower or not present in June and September. The peak in summer 2017 was recorded in
early August in the output station (St.2) with a density of 4895 cells L
−1
. The peak of summer 2016
coincides with a temperature of 28.4 °C, salinity
38.3 PSU, DIN, and PO 4 = 0.60 and 0.08 μmol L
−1
,
respectively, BOD = 35 mg L
−1
and chlorophylla = 2.99 μg L
−1
. Environmental parameters recorded
when the second peak occurred in 2017 were as
follows: the temperature = 28.6 °C, salinity = 38.4
PSU, DIN, and PO 4 = 0.61 and 0.13 μmol L
−1
,
BOD = 36 mg L
−1
, and chlorophyll-a = 2.36 μg L
−1
.
The cell abundance in the input water was positively and significantly correlated (R
2
= 0.91,
p < 0.001) with the cell abundance in the output
water. The abiotic factors (temperature, salinity,
DIN, PO 4 , BOD, and chlorophyll-a) in relation with
Fig. 4 Temporal variations
of a chlorophyll-a (μg/L) in
input and output water during 2016–2017 summers
Fig. 5 Temporal variations
of a biochemical oxygen
demand (BOD) (mg/L) in
input and output water during 2016–2017 summers