

Environ Monit Assess
(2021) 193:333
1 3
333
Page 4 of 12
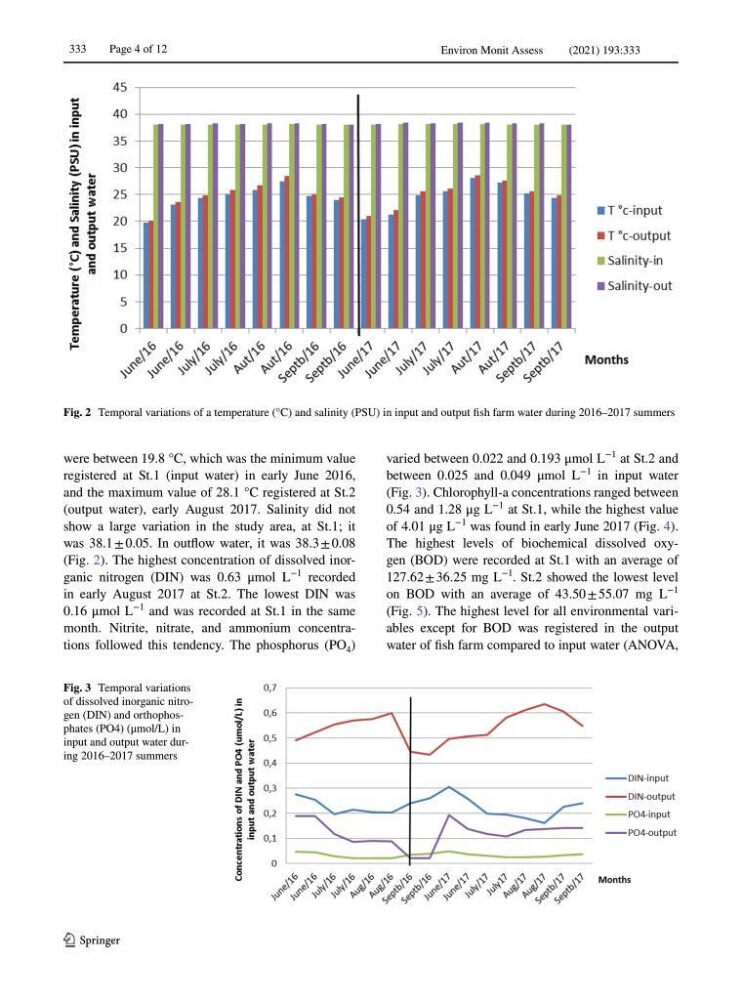
were between 19.8 °C, which was the minimum value
registered at St.1 (input water) in early June 2016,
and the maximum value of 28.1 °C registered at St.2
(output water), early August 2017. Salinity did not
show a large variation in the study area, at St.1; it
was 38.1 ± 0.05. In outflow water, it was 38.3 ± 0.08
(Fig. 2). The highest concentration of dissolved inorganic nitrogen (DIN) was 0.63 μmol L
−1
recorded
in early August 2017 at St.2. The lowest DIN was
0.16 μmol L
−1
and was recorded at St.1 in the same
month. Nitrite, nitrate, and ammonium concentrations followed this tendency. The phosphorus (PO 4 )
varied between 0.022 and 0.193 μmol L
−1
at St.2 and
between 0.025 and 0.049 μmol L
−1
in input water
(Fig. 3). Chlorophyll-a concentrations ranged between
0.54 and 1.28 μg L
−1
at St.1, while the highest value
of 4.01 μg L
−1
was found in early June 2017 (Fig. 4).
The highest levels of biochemical dissolved oxygen (BOD) were recorded at St.1 with an average of
127.62 ± 36.25 mg L
−1
. St.2 showed the lowest level
on BOD with an average of 43.50 ± 55.07 mg L
−1
(Fig. 5). The highest level for all environmental variables except for BOD was registered in the output
water of fish farm compared to input water (ANOVA,
Fig. 2 Temporal variations of a temperature (°C) and salinity (PSU) in input and output fish farm water during 2016–2017 summers
Fig. 3 Temporal variations
of dissolved inorganic nitrogen (DIN) and orthophosphates (PO4) (μmol/L) in
input and output water during 2016–2017 summers
(2021) 193:333
1 3
333
Page 4 of 12
were between 19.8 °C, which was the minimum value
registered at St.1 (input water) in early June 2016,
and the maximum value of 28.1 °C registered at St.2
(output water), early August 2017. Salinity did not
show a large variation in the study area, at St.1; it
was 38.1 ± 0.05. In outflow water, it was 38.3 ± 0.08
(Fig. 2). The highest concentration of dissolved inorganic nitrogen (DIN) was 0.63 μmol L
−1
recorded
in early August 2017 at St.2. The lowest DIN was
0.16 μmol L
−1
and was recorded at St.1 in the same
month. Nitrite, nitrate, and ammonium concentrations followed this tendency. The phosphorus (PO 4 )
varied between 0.022 and 0.193 μmol L
−1
at St.2 and
between 0.025 and 0.049 μmol L
−1
in input water
(Fig. 3). Chlorophyll-a concentrations ranged between
0.54 and 1.28 μg L
−1
at St.1, while the highest value
of 4.01 μg L
−1
was found in early June 2017 (Fig. 4).
The highest levels of biochemical dissolved oxygen (BOD) were recorded at St.1 with an average of
127.62 ± 36.25 mg L
−1
. St.2 showed the lowest level
on BOD with an average of 43.50 ± 55.07 mg L
−1
(Fig. 5). The highest level for all environmental variables except for BOD was registered in the output
water of fish farm compared to input water (ANOVA,
Fig. 2 Temporal variations of a temperature (°C) and salinity (PSU) in input and output fish farm water during 2016–2017 summers
Fig. 3 Temporal variations
of dissolved inorganic nitrogen (DIN) and orthophosphates (PO4) (μmol/L) in
input and output water during 2016–2017 summers