

Environ Monit Assess
(2021) 193:333
1 3
Page 3 of 12 333
water quality meter (Hanna HI 9828, precision 0.18 °C
for temperature and 0.05 for salinity).
Laboratory analysis
The analysis of phosphates, ammonia, nitrites, nitrates,
and chlorophyll-a was carried according to Amouroux and Claisse (2016). The water samples which were
used for nutrient analysis were immediately filtered
through filters (Whatman GF/F, porosity = 0.7 μm),
placed in a freezer, and analyzed within 24 h following the colorimetric method (Chifflet et al., 2004)
using an Autoanalyzer (SKALAR). Detectability limits were 0.02 μmol L
−1
for nitrates, nitrites, ammonia,
and orthophosphates. Dissolved inorganic nitrogen
(DIN) = nitrates + nitrites + ammonia. Chlorophyll-a was
estimated at 90% acetone extracts in darkness (Sun et al,
2016) and was measured by spectrophotometry (JASCO730). The biochemical oxygen demand (BOD) was
assessed following Jouanneau et al. (2014).
Ostreopsis cell abundance was assessed according to Utermöhl (1958) sedimentation method (50 mL
settled for 24 h in Utermöhl cylinders). They were
observed and counted under an inverted microscope
(OPTIKA-XDS) at magnifications × 400. Identification
of the dinoflagellate species was performed according
to several taxonomic publications (Faust & Gulledge,
2002; Hallegraeff et al., 2004). Owing to the difficulty
in differentiating Ostreopsis species using light microscopy, the study was limited to the genus level only.
Abundance of cells was expressed as cells × L
−1
.
Statistical analysis
Differences in the cell abundances were assessed
through a one-way analysis of variance (ANOVA)
and it was tested for significant correlations with all
recorded environmental parameters using PCA. Correlations between different variables were examined
using the Spearman rank order correlation since data
were not normally distributed. Friedman and MannWhitney test pairwise comparison test was also
performed to check the significance of differences
between different ensembles. The significance level of
p < 0.05 was taken. Statistical analyses were performed
using R (3.5.2) software and XLSTAT (free version).
Results
Environmental data
Abiotic parameters obtained during this study are
given in Figs. 2, 3, 4, and 5). Temperature variations
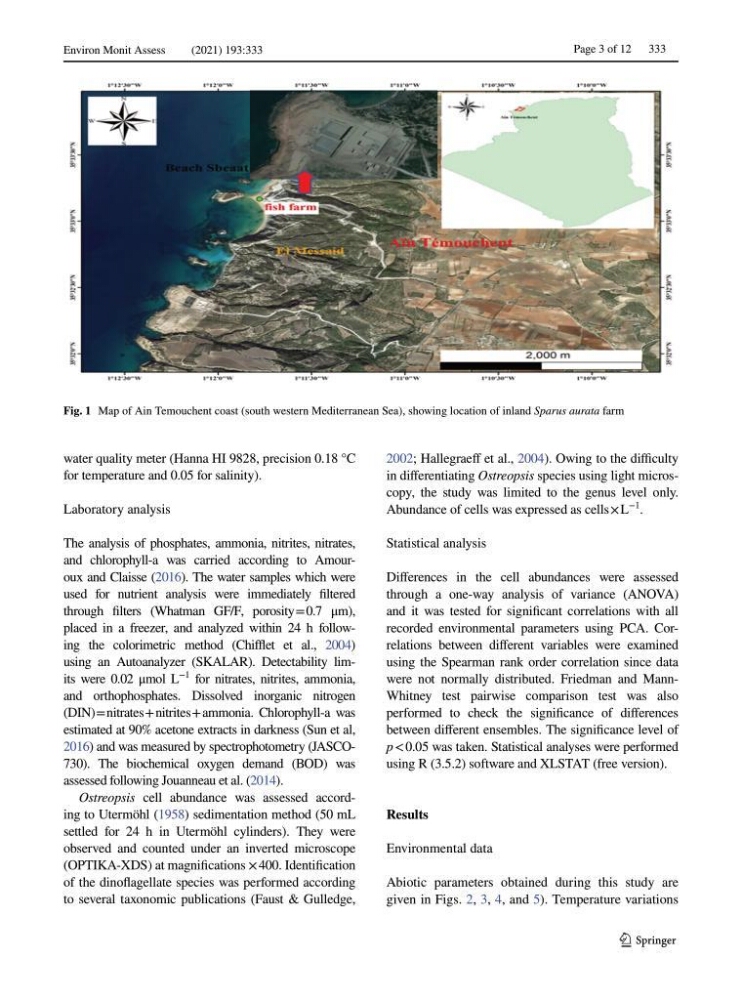
Fig. 1 Map of Ain Temouchent coast (south western Mediterranean Sea), showing location of inland Sparus aurata farm
(2021) 193:333
1 3
Page 3 of 12 333
water quality meter (Hanna HI 9828, precision 0.18 °C
for temperature and 0.05 for salinity).
Laboratory analysis
The analysis of phosphates, ammonia, nitrites, nitrates,
and chlorophyll-a was carried according to Amouroux and Claisse (2016). The water samples which were
used for nutrient analysis were immediately filtered
through filters (Whatman GF/F, porosity = 0.7 μm),
placed in a freezer, and analyzed within 24 h following the colorimetric method (Chifflet et al., 2004)
using an Autoanalyzer (SKALAR). Detectability limits were 0.02 μmol L
−1
for nitrates, nitrites, ammonia,
and orthophosphates. Dissolved inorganic nitrogen
(DIN) = nitrates + nitrites + ammonia. Chlorophyll-a was
estimated at 90% acetone extracts in darkness (Sun et al,
2016) and was measured by spectrophotometry (JASCO730). The biochemical oxygen demand (BOD) was
assessed following Jouanneau et al. (2014).
Ostreopsis cell abundance was assessed according to Utermöhl (1958) sedimentation method (50 mL
settled for 24 h in Utermöhl cylinders). They were
observed and counted under an inverted microscope
(OPTIKA-XDS) at magnifications × 400. Identification
of the dinoflagellate species was performed according
to several taxonomic publications (Faust & Gulledge,
2002; Hallegraeff et al., 2004). Owing to the difficulty
in differentiating Ostreopsis species using light microscopy, the study was limited to the genus level only.
Abundance of cells was expressed as cells × L
−1
.
Statistical analysis
Differences in the cell abundances were assessed
through a one-way analysis of variance (ANOVA)
and it was tested for significant correlations with all
recorded environmental parameters using PCA. Correlations between different variables were examined
using the Spearman rank order correlation since data
were not normally distributed. Friedman and MannWhitney test pairwise comparison test was also
performed to check the significance of differences
between different ensembles. The significance level of
p < 0.05 was taken. Statistical analyses were performed
using R (3.5.2) software and XLSTAT (free version).
Results
Environmental data
Abiotic parameters obtained during this study are
given in Figs. 2, 3, 4, and 5). Temperature variations
Fig. 1 Map of Ain Temouchent coast (south western Mediterranean Sea), showing location of inland Sparus aurata farm