

Chabet Dis, Refes, Varó, Hontoria, Amat and Navarro
4
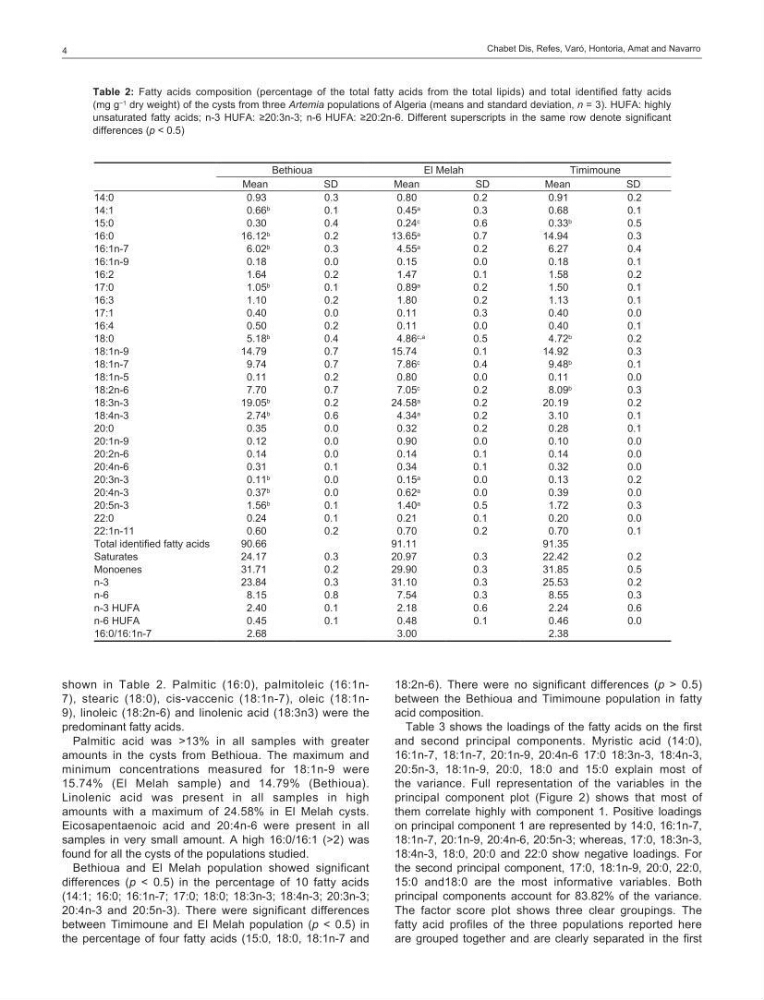
shown in Table 2. Palmitic (16:0), palmitoleic (16:1n7), stearic (18:0), cis-vaccenic (18:1n-7), oleic (18:1n9), linoleic (18:2n-6) and linolenic acid (18:3n3) were the
predominant fatty acids.
Palmitic acid was >13% in all samples with greater
amounts in the cysts from Bethioua. The maximum and
minimum concentrations measured for 18:1n-9 were
15.74% (El Melah sample) and 14.79% (Bethioua).
Linolenic acid was present in all samples in high
amounts with a maximum of 24.58% in El Melah cysts.
Eicosapentaenoic acid and 20:4n-6 were present in all
samples in very small amount. A high 16:0/16:1 (>2) was
found for all the cysts of the populations studied.
Bethioua and El Melah population showed significant
differences (p < 0.5) in the percentage of 10 fatty acids
(14:1; 16:0; 16:1n-7; 17:0; 18:0; 18:3n-3; 18:4n-3; 20:3n-3;
20:4n-3 and 20:5n-3). There were significant differences
between Timimoune and El Melah population (p < 0.5) in
the percentage of four fatty acids (15:0, 18:0, 18:1n-7 and
18:2n-6). There were no significant differences (p > 0.5)
between the Bethioua and Timimoune population in fatty
acid composition.
Table 3 shows the loadings of the fatty acids on the first
and second principal components. Myristic acid (14:0),
16:1n-7, 18:1n-7, 20:1n-9, 20:4n-6 17:0 18:3n-3, 18:4n-3,
20:5n-3, 18:1n-9, 20:0, 18:0 and 15:0 explain most of
the variance. Full representation of the variables in the
principal component plot (Figure 2) shows that most of
them correlate highly with component 1. Positive loadings
on principal component 1 are represented by 14:0, 16:1n-7,
18:1n-7, 20:1n-9, 20:4n-6, 20:5n-3; whereas, 17:0, 18:3n-3,
18:4n-3, 18:0, 20:0 and 22:0 show negative loadings. For
the second principal component, 17:0, 18:1n-9, 20:0, 22:0,
15:0 and18:0 are the most informative variables. Both
principal components account for 83.82% of the variance.
The factor score plot shows three clear groupings. The
fatty acid profiles of the three populations reported here
are grouped together and are clearly separated in the first
Bethioua
El Melah
Timimoune
Mean
SD
Mean
SD
Mean
SD
14:0
0.93
0.3
0.80
0.2
0.91
0.2
14:1
0.66
b
0.1
0.45
a
0.3
0.68
0.1
15:0
0.30
0.4
0.24
c
0.6
0.33
b
0.5
16:0
16.12
b
0.2
13.65
a
0.7
14.94
0.3
16:1n-7
6.02
b
0.3
4.55
a
0.2
6.27
0.4
16:1n-9
0.18
0.0
0.15
0.0
0.18
0.1
16:2
1.64
0.2
1.47
0.1
1.58
0.2
17:0
1.05
b
0.1
0.89
a
0.2
1.50
0.1
16:3
1.10
0.2
1.80
0.2
1.13
0.1
17:1
0.40
0.0
0.11
0.3
0.40
0.0
16:4
0.50
0.2
0.11
0.0
0.40
0.1
18:0
5.18
b
0.4
4.86
c,a
0.5
4.72
b
0.2
18:1n-9
14.79
0.7
15.74
0.1
14.92
0.3
18:1n-7
9.74
0.7
7.86
c
0.4
9.48 b
0.1
18:1n-5
0.11
0.2
0.80
0.0
0.11
0.0
18:2n-6
7.70
0.7
7.05 c
0.2
8.09 b
0.3
18:3n-3
19.05 b
0.2
24.58 a
0.2
20.19
0.2
18:4n-3
2.74 b
0.6
4.34 a
0.2
3.10
0.1
20:0
0.35
0.0
0.32
0.2
0.28
0.1
20:1n-9
0.12
0.0
0.90
0.0
0.10
0.0
20:2n-6
0.14
0.0
0.14
0.1
0.14
0.0
20:4n-6
0.31
0.1
0.34
0.1
0.32
0.0
20:3n-3
0.11 b
0.0
0.15 a
0.0
0.13
0.2
20:4n-3
0.37 b
0.0
0.62 a
0.0
0.39
0.0
20:5n-3
1.56 b
0.1
1.40 a
0.5
1.72
0.3
22:0
0.24
0.1
0.21
0.1
0.20
0.0
22:1n-11
0.60
0.2
0.70
0.2
0.70
0.1
Total identified fatty acids
90.66
91.11
91.35
Saturates
24.17
0.3
20.97
0.3
22.42
0.2
Monoenes
31.71
0.2
29.90
0.3
31.85
0.5
n-3
23.84
0.3
31.10
0.3
25.53
0.2
n-6
8.15
0.8
7.54
0.3
8.55
0.3
n-3 HUFA
2.40
0.1
2.18
0.6
2.24
0.6
n-6 HUFA
0.45
0.1
0.48
0.1
0.46
0.0
16:0/16:1n-7
2.68
3.00
2.38
Table 2: Fatty acids composition (percentage of the total fatty acids from the total lipids) and total identified fatty acids
(mg g
−1 dry weight) of the cysts from three Artemia populations of Algeria (means and standard deviation, n = 3). HUFA: highly
unsaturated fatty acids; n-3 HUFA: ≥20:3n-3; n-6 HUFA: ≥20:2n-6. Different superscripts in the same row denote significant
differences (p < 0.5)
4
shown in Table 2. Palmitic (16:0), palmitoleic (16:1n7), stearic (18:0), cis-vaccenic (18:1n-7), oleic (18:1n9), linoleic (18:2n-6) and linolenic acid (18:3n3) were the
predominant fatty acids.
Palmitic acid was >13% in all samples with greater
amounts in the cysts from Bethioua. The maximum and
minimum concentrations measured for 18:1n-9 were
15.74% (El Melah sample) and 14.79% (Bethioua).
Linolenic acid was present in all samples in high
amounts with a maximum of 24.58% in El Melah cysts.
Eicosapentaenoic acid and 20:4n-6 were present in all
samples in very small amount. A high 16:0/16:1 (>2) was
found for all the cysts of the populations studied.
Bethioua and El Melah population showed significant
differences (p < 0.5) in the percentage of 10 fatty acids
(14:1; 16:0; 16:1n-7; 17:0; 18:0; 18:3n-3; 18:4n-3; 20:3n-3;
20:4n-3 and 20:5n-3). There were significant differences
between Timimoune and El Melah population (p < 0.5) in
the percentage of four fatty acids (15:0, 18:0, 18:1n-7 and
18:2n-6). There were no significant differences (p > 0.5)
between the Bethioua and Timimoune population in fatty
acid composition.
Table 3 shows the loadings of the fatty acids on the first
and second principal components. Myristic acid (14:0),
16:1n-7, 18:1n-7, 20:1n-9, 20:4n-6 17:0 18:3n-3, 18:4n-3,
20:5n-3, 18:1n-9, 20:0, 18:0 and 15:0 explain most of
the variance. Full representation of the variables in the
principal component plot (Figure 2) shows that most of
them correlate highly with component 1. Positive loadings
on principal component 1 are represented by 14:0, 16:1n-7,
18:1n-7, 20:1n-9, 20:4n-6, 20:5n-3; whereas, 17:0, 18:3n-3,
18:4n-3, 18:0, 20:0 and 22:0 show negative loadings. For
the second principal component, 17:0, 18:1n-9, 20:0, 22:0,
15:0 and18:0 are the most informative variables. Both
principal components account for 83.82% of the variance.
The factor score plot shows three clear groupings. The
fatty acid profiles of the three populations reported here
are grouped together and are clearly separated in the first
Bethioua
El Melah
Timimoune
Mean
SD
Mean
SD
Mean
SD
14:0
0.93
0.3
0.80
0.2
0.91
0.2
14:1
0.66
b
0.1
0.45
a
0.3
0.68
0.1
15:0
0.30
0.4
0.24
c
0.6
0.33
b
0.5
16:0
16.12
b
0.2
13.65
a
0.7
14.94
0.3
16:1n-7
6.02
b
0.3
4.55
a
0.2
6.27
0.4
16:1n-9
0.18
0.0
0.15
0.0
0.18
0.1
16:2
1.64
0.2
1.47
0.1
1.58
0.2
17:0
1.05
b
0.1
0.89
a
0.2
1.50
0.1
16:3
1.10
0.2
1.80
0.2
1.13
0.1
17:1
0.40
0.0
0.11
0.3
0.40
0.0
16:4
0.50
0.2
0.11
0.0
0.40
0.1
18:0
5.18
b
0.4
4.86
c,a
0.5
4.72
b
0.2
18:1n-9
14.79
0.7
15.74
0.1
14.92
0.3
18:1n-7
9.74
0.7
7.86
c
0.4
9.48 b
0.1
18:1n-5
0.11
0.2
0.80
0.0
0.11
0.0
18:2n-6
7.70
0.7
7.05 c
0.2
8.09 b
0.3
18:3n-3
19.05 b
0.2
24.58 a
0.2
20.19
0.2
18:4n-3
2.74 b
0.6
4.34 a
0.2
3.10
0.1
20:0
0.35
0.0
0.32
0.2
0.28
0.1
20:1n-9
0.12
0.0
0.90
0.0
0.10
0.0
20:2n-6
0.14
0.0
0.14
0.1
0.14
0.0
20:4n-6
0.31
0.1
0.34
0.1
0.32
0.0
20:3n-3
0.11 b
0.0
0.15 a
0.0
0.13
0.2
20:4n-3
0.37 b
0.0
0.62 a
0.0
0.39
0.0
20:5n-3
1.56 b
0.1
1.40 a
0.5
1.72
0.3
22:0
0.24
0.1
0.21
0.1
0.20
0.0
22:1n-11
0.60
0.2
0.70
0.2
0.70
0.1
Total identified fatty acids
90.66
91.11
91.35
Saturates
24.17
0.3
20.97
0.3
22.42
0.2
Monoenes
31.71
0.2
29.90
0.3
31.85
0.5
n-3
23.84
0.3
31.10
0.3
25.53
0.2
n-6
8.15
0.8
7.54
0.3
8.55
0.3
n-3 HUFA
2.40
0.1
2.18
0.6
2.24
0.6
n-6 HUFA
0.45
0.1
0.48
0.1
0.46
0.0
16:0/16:1n-7
2.68
3.00
2.38
Table 2: Fatty acids composition (percentage of the total fatty acids from the total lipids) and total identified fatty acids
(mg g
−1 dry weight) of the cysts from three Artemia populations of Algeria (means and standard deviation, n = 3). HUFA: highly
unsaturated fatty acids; n-3 HUFA: ≥20:3n-3; n-6 HUFA: ≥20:2n-6. Different superscripts in the same row denote significant
differences (p < 0.5)