

African Journal of Aquatic Science 2021: 1–9
3
extra (Kassambara and Mundt 2016) packages in the
statistical environment R version 3.6.1 (R Development Core
Team 2014). The results of fatty acid composition, biometry
and hatching characteristics were compared between the
different populations using ANOVA (p < 0.5). Selected fatty
acids (14:0, 15:0, 16:0, 16:1n-7, 17:0, 18:0, 18:1n-9, 18:1n-7,
18:3n-3, 18:4n-3, 20:0, 20:1n-9, 20:4n-6, 20:5n-3 and 22:0)
were used as variables and analysed through principal
components analysis (PCA). Comparitive data from Ghomari
(2013) were introduced in the model to validate the final
score plot using the two first components.
Results
Biometry and hatching
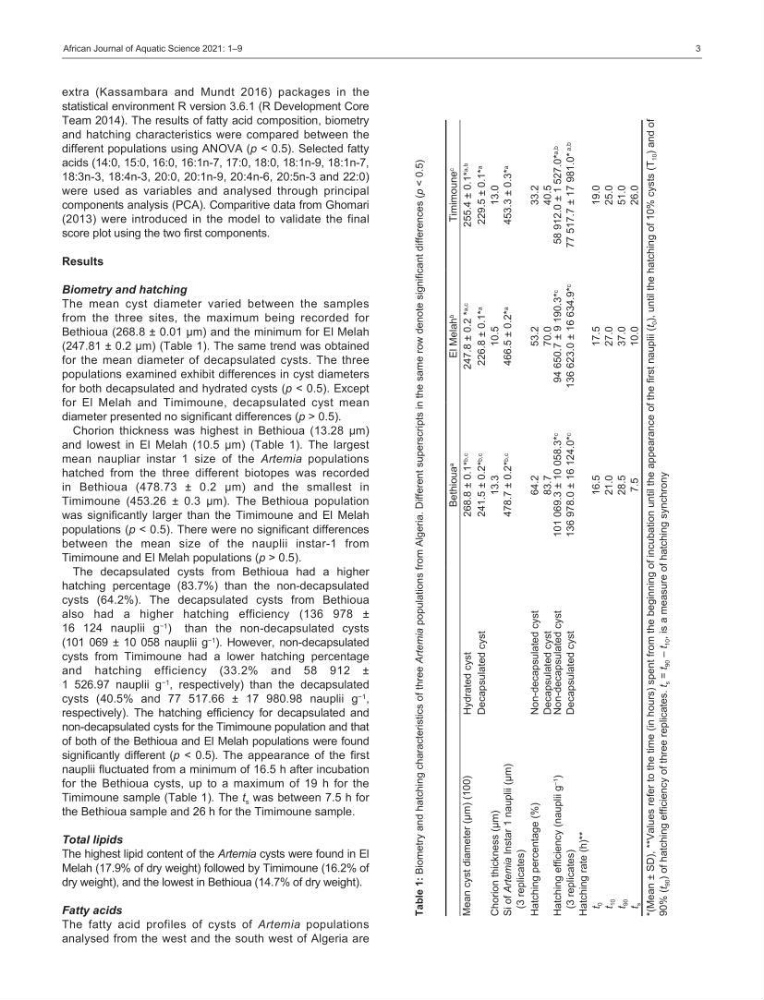
The mean cyst diameter varied between the samples
from the three sites, the maximum being recorded for
Bethioua (268.8 ± 0.01 µm) and the minimum for El Melah
(247.81 ± 0.2 µm) (Table 1). The same trend was obtained
for the mean diameter of decapsulated cysts. The three
populations examined exhibit differences in cyst diameters
for both decapsulated and hydrated cysts (p < 0.5). Except
for El Melah and Timimoune, decapsulated cyst mean
diameter presented no significant differences (p > 0.5).
Chorion thickness was highest in Bethioua (13.28 µm)
and lowest in El Melah (10.5 µm) (Table 1). The largest
mean naupliar instar 1 size of the Artemia populations
hatched from the three different biotopes was recorded
in Bethioua (478.73 ± 0.2 µm) and the smallest in
Timimoune (453.26 ± 0.3 µm). The Bethioua population
was significantly larger than the Timimoune and El Melah
populations (p < 0.5). There were no significant differences
between the mean size of the nauplii instar-1 from
Timimoune and El Melah populations (p > 0.5).
The decapsulated cysts from Bethioua had a higher
hatching percentage (83.7%) than the non-decapsulated
cysts (64.2%). The decapsulated cysts from Bethioua
also had a higher hatching efficiency (136 978 ±
16 124 nauplii g −1 ) than the non-decapsulated cysts
(101 069 ± 10 058 nauplii g −1 ). However, non-decapsulated
cysts from Timimoune had a lower hatching percentage
and hatching efficiency (33.2% and 58 912 ±
1 526.97 nauplii g −1 , respectively) than the decapsulated
cysts (40.5% and 77 517.66 ± 17 980.98 nauplii g −1 ,
respectively). The hatching efficiency for decapsulated and
non-decapsulated cysts for the Timimoune population and that
of both of the Bethioua and El Melah populations were found
significantly different (p < 0.5). The appearance of the first
nauplii fluctuated from a minimum of 16.5 h after incubation
for the Bethioua cysts, up to a maximum of 19 h for the
Timimoune sample (Table 1). The t s was between 7.5 h for
the Bethioua sample and 26 h for the Timimoune sample.
Total lipids
The highest lipid content of the Artemia cysts were found in El
Melah (17.9% of dry weight) followed by Timimoune (16.2% of
dry weight), and the lowest in Bethioua (14.7% of dry weight).
Fatty acids
The fatty acid profiles of cysts of Artemia populations
analysed from the west and the south west of Algeria are
Bethioua a
El Melah b
Timimoune c
Mean cyst diameter (µm) (100)
Hydrated cyst
268.8 ± 0.1* b,c
247.8 ± 0.2 * a,c
255.4 ± 0.1* a,b
Decapsulated cyst
241.5 ± 0.2* b,c
226.8 ± 0.1* a
229.5 ± 0.1* a
Chorion thickness (µm)
13.3
10.5
13.0
Si of Artemia Instar 1 nauplii (µm)
(3 replicates)
478.7 ± 0.2*
b,c
466.5 ± 0.2*
a
453.3 ± 0.3*
a
Hatching percentage (%)
Non-decapsulated cyst
64.2
53.2
33.2
Decapsulated cyst
83.7
70.0
40.5
Hatching efficiency (nauplii g −1
)
(3 replicates)
Non-decapsulated cyst
101 069.3 ± 10 058.3*
c
94 650.7 ± 9 190.3*
c
58 912.0 ± 1 527.0*
a,b
Decapsulated cyst
136 978.0 ± 16 124.0*
c
136 623.0 ± 16 634.9*
c
77 517.7 ± 17 981.0*
a,b
Hatching rate (h)**
t
0
16.5
17.5
19.0
t
10
21.0
27.0
25.0
t
90
28.5
37.0
51.0
t
s
7.5
10.0
26.0
*(Mean ± SD), **Values refer to the time (in hours) spent from the beginning of incubation until the appearance of the first nauplii (t
0 ), until the hatching of 10% cysts (T
10 ) and of
90% (t
90 ) of hatching efficiency of three replicates. t
s = t
90 – t
10 , is a measure of hatching synchrony
Table 1: Biometry and hatching characteristics of three Artemia populations from Algeria. Different superscripts in the same row denote significant differences (p < 0.5)
3
extra (Kassambara and Mundt 2016) packages in the
statistical environment R version 3.6.1 (R Development Core
Team 2014). The results of fatty acid composition, biometry
and hatching characteristics were compared between the
different populations using ANOVA (p < 0.5). Selected fatty
acids (14:0, 15:0, 16:0, 16:1n-7, 17:0, 18:0, 18:1n-9, 18:1n-7,
18:3n-3, 18:4n-3, 20:0, 20:1n-9, 20:4n-6, 20:5n-3 and 22:0)
were used as variables and analysed through principal
components analysis (PCA). Comparitive data from Ghomari
(2013) were introduced in the model to validate the final
score plot using the two first components.
Results
Biometry and hatching
The mean cyst diameter varied between the samples
from the three sites, the maximum being recorded for
Bethioua (268.8 ± 0.01 µm) and the minimum for El Melah
(247.81 ± 0.2 µm) (Table 1). The same trend was obtained
for the mean diameter of decapsulated cysts. The three
populations examined exhibit differences in cyst diameters
for both decapsulated and hydrated cysts (p < 0.5). Except
for El Melah and Timimoune, decapsulated cyst mean
diameter presented no significant differences (p > 0.5).
Chorion thickness was highest in Bethioua (13.28 µm)
and lowest in El Melah (10.5 µm) (Table 1). The largest
mean naupliar instar 1 size of the Artemia populations
hatched from the three different biotopes was recorded
in Bethioua (478.73 ± 0.2 µm) and the smallest in
Timimoune (453.26 ± 0.3 µm). The Bethioua population
was significantly larger than the Timimoune and El Melah
populations (p < 0.5). There were no significant differences
between the mean size of the nauplii instar-1 from
Timimoune and El Melah populations (p > 0.5).
The decapsulated cysts from Bethioua had a higher
hatching percentage (83.7%) than the non-decapsulated
cysts (64.2%). The decapsulated cysts from Bethioua
also had a higher hatching efficiency (136 978 ±
16 124 nauplii g −1 ) than the non-decapsulated cysts
(101 069 ± 10 058 nauplii g −1 ). However, non-decapsulated
cysts from Timimoune had a lower hatching percentage
and hatching efficiency (33.2% and 58 912 ±
1 526.97 nauplii g −1 , respectively) than the decapsulated
cysts (40.5% and 77 517.66 ± 17 980.98 nauplii g −1 ,
respectively). The hatching efficiency for decapsulated and
non-decapsulated cysts for the Timimoune population and that
of both of the Bethioua and El Melah populations were found
significantly different (p < 0.5). The appearance of the first
nauplii fluctuated from a minimum of 16.5 h after incubation
for the Bethioua cysts, up to a maximum of 19 h for the
Timimoune sample (Table 1). The t s was between 7.5 h for
the Bethioua sample and 26 h for the Timimoune sample.
Total lipids
The highest lipid content of the Artemia cysts were found in El
Melah (17.9% of dry weight) followed by Timimoune (16.2% of
dry weight), and the lowest in Bethioua (14.7% of dry weight).
Fatty acids
The fatty acid profiles of cysts of Artemia populations
analysed from the west and the south west of Algeria are
Bethioua a
El Melah b
Timimoune c
Mean cyst diameter (µm) (100)
Hydrated cyst
268.8 ± 0.1* b,c
247.8 ± 0.2 * a,c
255.4 ± 0.1* a,b
Decapsulated cyst
241.5 ± 0.2* b,c
226.8 ± 0.1* a
229.5 ± 0.1* a
Chorion thickness (µm)
13.3
10.5
13.0
Si of Artemia Instar 1 nauplii (µm)
(3 replicates)
478.7 ± 0.2*
b,c
466.5 ± 0.2*
a
453.3 ± 0.3*
a
Hatching percentage (%)
Non-decapsulated cyst
64.2
53.2
33.2
Decapsulated cyst
83.7
70.0
40.5
Hatching efficiency (nauplii g −1
)
(3 replicates)
Non-decapsulated cyst
101 069.3 ± 10 058.3*
c
94 650.7 ± 9 190.3*
c
58 912.0 ± 1 527.0*
a,b
Decapsulated cyst
136 978.0 ± 16 124.0*
c
136 623.0 ± 16 634.9*
c
77 517.7 ± 17 981.0*
a,b
Hatching rate (h)**
t
0
16.5
17.5
19.0
t
10
21.0
27.0
25.0
t
90
28.5
37.0
51.0
t
s
7.5
10.0
26.0
*(Mean ± SD), **Values refer to the time (in hours) spent from the beginning of incubation until the appearance of the first nauplii (t
0 ), until the hatching of 10% cysts (T
10 ) and of
90% (t
90 ) of hatching efficiency of three replicates. t
s = t
90 – t
10 , is a measure of hatching synchrony
Table 1: Biometry and hatching characteristics of three Artemia populations from Algeria. Different superscripts in the same row denote significant differences (p < 0.5)