

Groundwater for Sustainable Development 11 (2020) 100481
7
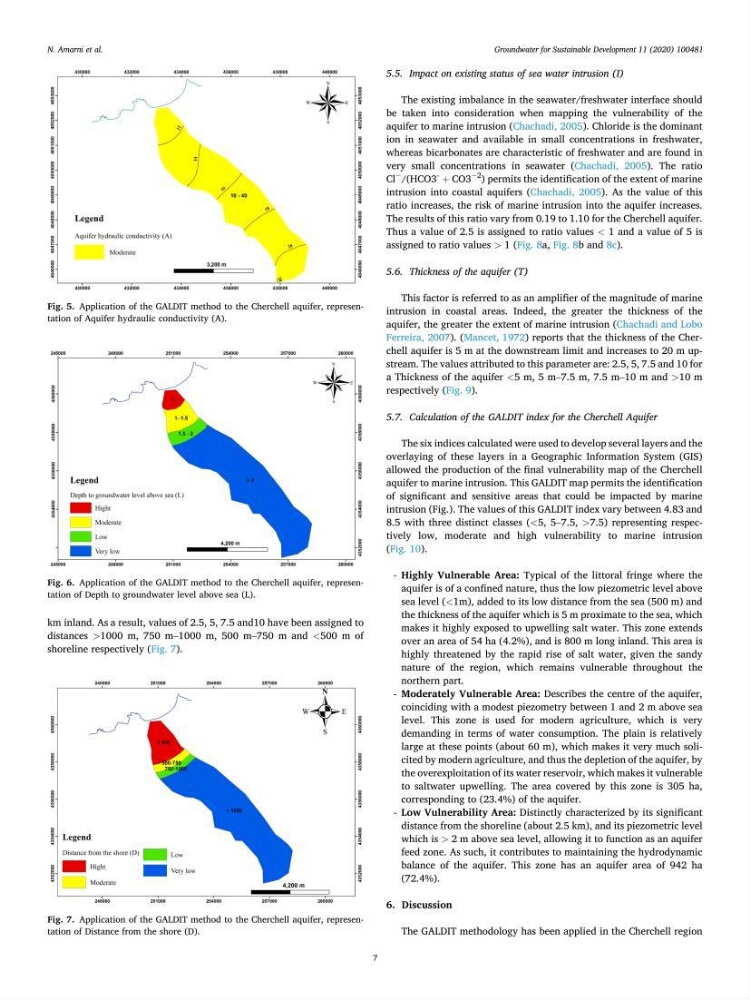
km inland. As a result, values of 2.5, 5, 7.5 and10 have been assigned to
distances >1000 m, 750 m–1000 m, 500 m–750 m and <500 m of
shoreline respectively (Fig. 7).
5.5. Impact on existing status of sea water intrusion (I)
The existing imbalance in the seawater/freshwater interface should
be taken into consideration when mapping the vulnerability of the
aquifer to marine intrusion (Chachadi, 2005). Chloride is the dominant
ion in seawater and available in small concentrations in freshwater,
whereas bicarbonates are characteristic of freshwater and are found in
very small concentrations in seawater (Chachadi, 2005). The ratio
Cl
−
/(HCO3
- + CO3
− 2
) permits the identification of the extent of marine
intrusion into coastal aquifers (Chachadi, 2005). As the value of this
ratio increases, the risk of marine intrusion into the aquifer increases.
The results of this ratio vary from 0.19 to 1.10 for the Cherchell aquifer.
Thus a value of 2.5 is assigned to ratio values < 1 and a value of 5 is
assigned to ratio values > 1 (Fig. 8a, Fig. 8b and 8c).
5.6. Thickness of the aquifer (T)
This factor is referred to as an amplifier of the magnitude of marine
intrusion in coastal areas. Indeed, the greater the thickness of the
aquifer, the greater the extent of marine intrusion (Chachadi and Lobo
Ferreira, 2007). (Mancet, 1972) reports that the thickness of the Cherchell aquifer is 5 m at the downstream limit and increases to 20 m upstream. The values attributed to this parameter are: 2.5, 5, 7.5 and 10 for
a Thickness of the aquifer <5 m, 5 m–7.5 m, 7.5 m–10 m and >10 m
respectively (Fig. 9).
5.7. Calculation of the GALDIT index for the Cherchell Aquifer
The six indices calculated were used to develop several layers and the
overlaying of these layers in a Geographic Information System (GIS)
allowed the production of the final vulnerability map of the Cherchell
aquifer to marine intrusion. This GALDIT map permits the identification
of significant and sensitive areas that could be impacted by marine
intrusion (Fig.). The values of this GALDIT index vary between 4.83 and
8.5 with three distinct classes (<5, 5–7.5, >7.5) representing respectively low, moderate and high vulnerability to marine intrusion
(Fig. 10).
- Highly Vulnerable Area: Typical of the littoral fringe where the
aquifer is of a confined nature, thus the low piezometric level above
sea level (<1m), added to its low distance from the sea (500 m) and
the thickness of the aquifer which is 5 m proximate to the sea, which
makes it highly exposed to upwelling salt water. This zone extends
over an area of 54 ha (4.2%), and is 800 m long inland. This area is
highly threatened by the rapid rise of salt water, given the sandy
nature of the region, which remains vulnerable throughout the
northern part.
- Moderately Vulnerable Area: Describes the centre of the aquifer,
coinciding with a modest piezometry between 1 and 2 m above sea
level. This zone is used for modern agriculture, which is very
demanding in terms of water consumption. The plain is relatively
large at these points (about 60 m), which makes it very much solicited by modern agriculture, and thus the depletion of the aquifer, by
the overexploitation of its water reservoir, which makes it vulnerable
to saltwater upwelling. The area covered by this zone is 305 ha,
corresponding to (23.4%) of the aquifer.
- Low Vulnerability Area: Distinctly characterized by its significant
distance from the shoreline (about 2.5 km), and its piezometric level
which is > 2 m above sea level, allowing it to function as an aquifer
feed zone. As such, it contributes to maintaining the hydrodynamic
balance of the aquifer. This zone has an aquifer area of 942 ha
(72.4%).
6. Discussion
The GALDIT methodology has been applied in the Cherchell region
Fig. 5. Application of the GALDIT method to the Cherchell aquifer, representation of Aquifer hydraulic conductivity (A).
Fig. 6. Application of the GALDIT method to the Cherchell aquifer, representation of Depth to groundwater level above sea (L).
Fig. 7. Application of the GALDIT method to the Cherchell aquifer, representation of Distance from the shore (D).
N. Amarni et al.
7
km inland. As a result, values of 2.5, 5, 7.5 and10 have been assigned to
distances >1000 m, 750 m–1000 m, 500 m–750 m and <500 m of
shoreline respectively (Fig. 7).
5.5. Impact on existing status of sea water intrusion (I)
The existing imbalance in the seawater/freshwater interface should
be taken into consideration when mapping the vulnerability of the
aquifer to marine intrusion (Chachadi, 2005). Chloride is the dominant
ion in seawater and available in small concentrations in freshwater,
whereas bicarbonates are characteristic of freshwater and are found in
very small concentrations in seawater (Chachadi, 2005). The ratio
Cl
−
/(HCO3
- + CO3
− 2
) permits the identification of the extent of marine
intrusion into coastal aquifers (Chachadi, 2005). As the value of this
ratio increases, the risk of marine intrusion into the aquifer increases.
The results of this ratio vary from 0.19 to 1.10 for the Cherchell aquifer.
Thus a value of 2.5 is assigned to ratio values < 1 and a value of 5 is
assigned to ratio values > 1 (Fig. 8a, Fig. 8b and 8c).
5.6. Thickness of the aquifer (T)
This factor is referred to as an amplifier of the magnitude of marine
intrusion in coastal areas. Indeed, the greater the thickness of the
aquifer, the greater the extent of marine intrusion (Chachadi and Lobo
Ferreira, 2007). (Mancet, 1972) reports that the thickness of the Cherchell aquifer is 5 m at the downstream limit and increases to 20 m upstream. The values attributed to this parameter are: 2.5, 5, 7.5 and 10 for
a Thickness of the aquifer <5 m, 5 m–7.5 m, 7.5 m–10 m and >10 m
respectively (Fig. 9).
5.7. Calculation of the GALDIT index for the Cherchell Aquifer
The six indices calculated were used to develop several layers and the
overlaying of these layers in a Geographic Information System (GIS)
allowed the production of the final vulnerability map of the Cherchell
aquifer to marine intrusion. This GALDIT map permits the identification
of significant and sensitive areas that could be impacted by marine
intrusion (Fig.). The values of this GALDIT index vary between 4.83 and
8.5 with three distinct classes (<5, 5–7.5, >7.5) representing respectively low, moderate and high vulnerability to marine intrusion
(Fig. 10).
- Highly Vulnerable Area: Typical of the littoral fringe where the
aquifer is of a confined nature, thus the low piezometric level above
sea level (<1m), added to its low distance from the sea (500 m) and
the thickness of the aquifer which is 5 m proximate to the sea, which
makes it highly exposed to upwelling salt water. This zone extends
over an area of 54 ha (4.2%), and is 800 m long inland. This area is
highly threatened by the rapid rise of salt water, given the sandy
nature of the region, which remains vulnerable throughout the
northern part.
- Moderately Vulnerable Area: Describes the centre of the aquifer,
coinciding with a modest piezometry between 1 and 2 m above sea
level. This zone is used for modern agriculture, which is very
demanding in terms of water consumption. The plain is relatively
large at these points (about 60 m), which makes it very much solicited by modern agriculture, and thus the depletion of the aquifer, by
the overexploitation of its water reservoir, which makes it vulnerable
to saltwater upwelling. The area covered by this zone is 305 ha,
corresponding to (23.4%) of the aquifer.
- Low Vulnerability Area: Distinctly characterized by its significant
distance from the shoreline (about 2.5 km), and its piezometric level
which is > 2 m above sea level, allowing it to function as an aquifer
feed zone. As such, it contributes to maintaining the hydrodynamic
balance of the aquifer. This zone has an aquifer area of 942 ha
(72.4%).
6. Discussion
The GALDIT methodology has been applied in the Cherchell region
Fig. 5. Application of the GALDIT method to the Cherchell aquifer, representation of Aquifer hydraulic conductivity (A).
Fig. 6. Application of the GALDIT method to the Cherchell aquifer, representation of Depth to groundwater level above sea (L).
Fig. 7. Application of the GALDIT method to the Cherchell aquifer, representation of Distance from the shore (D).
N. Amarni et al.