

THERMAL DEGRADA‘I‘ION OF VIRUSES
111
plot, time was placed on the x—axis as a log scale. To obtain a straight line function, the
following transformations of k1’s were used empirically for the y-axis :
a
10
k
1
)
g
1
d)
,
1 —— log k1
1
k
b) ——
e)
_1
log k1
log k1
.
c) 1 — log k1
f)
k1
_
1 — log k1
°C
+30°
—IO‘
-30°
+40°
+20°
0°
—20°
—40°
LO
0.6
.
0.3
C.!
.06
.03
-—|
.Ol
!
.006
.003
.OOI
,0006
.0003
_‘°°°' 3.0
3.2
3.4
3.63.8
4.0
4.2
4.4
1
|
-
3
——-——
x IO,
273 + 1‘
‘
_
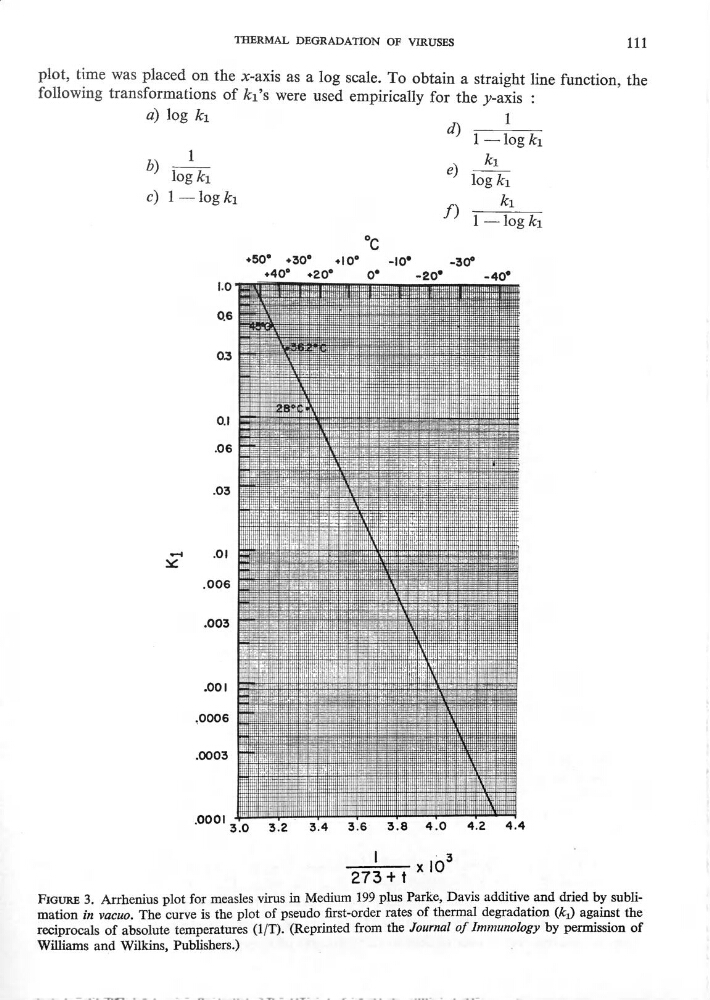
FIGURE 3. Arrhenius plot for measles virus in Medium 199 plus Parke, Davis additive and
dried b_y
SUbh“
mation in vacuo. The curve is the plot of pseudo rst—order rates. of thermal degradation (ki) against
the
reciprocals of absolute temperatures (1/T). (Reprinted from the Journal of Immunol0gy by perm15s1on of
Williams and Wilkins, Publishers.)
_
_
,
.
111
plot, time was placed on the x—axis as a log scale. To obtain a straight line function, the
following transformations of k1’s were used empirically for the y-axis :
a
10
k
1
)
g
1
d)
,
1 —— log k1
1
k
b) ——
e)
_1
log k1
log k1
.
c) 1 — log k1
f)
k1
_
1 — log k1
°C
+30°
—IO‘
-30°
+40°
+20°
0°
—20°
—40°
LO
0.6
.
0.3
C.!
.06
.03
-—|
.Ol
!
.006
.003
.OOI
,0006
.0003
_‘°°°' 3.0
3.2
3.4
3.63.8
4.0
4.2
4.4
1
|
-
3
——-——
x IO,
273 + 1‘
‘
_
FIGURE 3. Arrhenius plot for measles virus in Medium 199 plus Parke, Davis additive and
dried b_y
SUbh“
mation in vacuo. The curve is the plot of pseudo rst—order rates. of thermal degradation (ki) against
the
reciprocals of absolute temperatures (1/T). (Reprinted from the Journal of Immunol0gy by perm15s1on of
Williams and Wilkins, Publishers.)
_
_
,
.