

112
FREEZE-DRYING
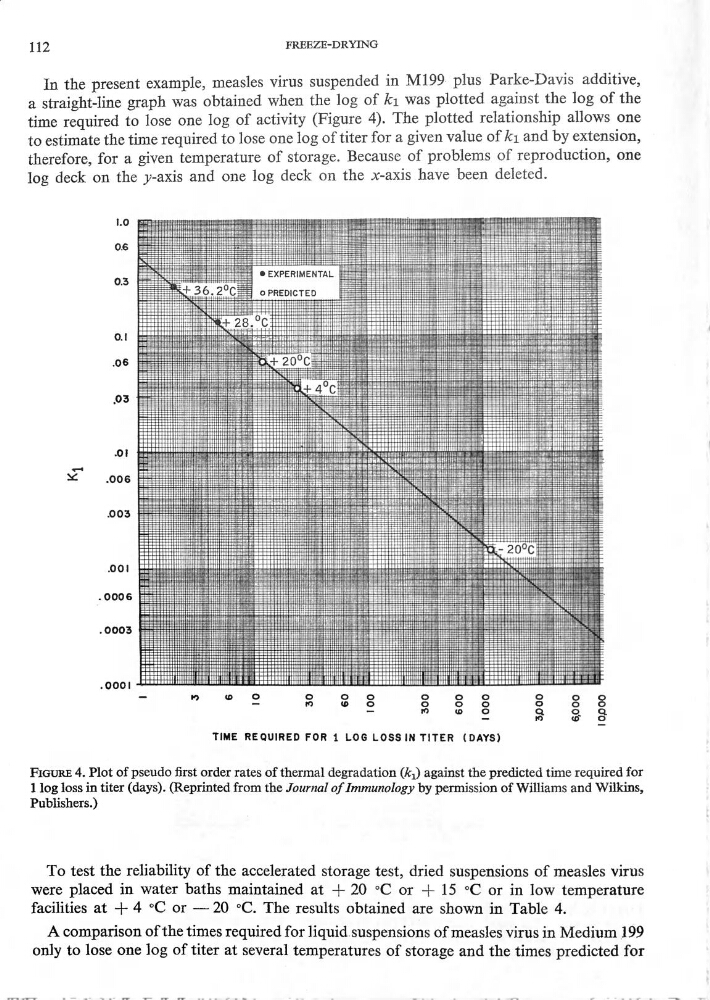
In thepresent example, measles virus suspended in M199- plus Parke—Davis additive,
a straight—line graph was obtained when the log of k1 was plotted against the log of the
time required to lose one log of activity (Figure 4). The plotted relat10nsh1p allows one
to estimate the time required to lose one log of titer for a given value of k1 and by extensmu,
therefore, for a given temperature of storage. Because of problems of reproduction, one
log deck on the y—axis and one log deck on the x—axis have been deleted.
to
05
05
. EXPERIMENTÀL
2
OPREDICTED
28
o.:
.06
+ 2
C
.
_03
.ou
;
.ooe
.003
20
.001
.0003
.com
—
D‘)
‘0
°
O
O
O
O
O
O
°
O
O
—
I°
@
O
O
O
O
O
O
O
—
IO
(D
0
Q
0
Q
_
m
a!“
g
FOR 1 LOG LOSSIN TITER
(DAYS)
FIGURE 4. Plot of pseudo rst order rates of thermal degradation (ki) against the predicted time required for
1 log loss in titer (days). (Reprinted from the Jaurnal oflmmunology by permission of Williams and Wilkins,
Publishers.)
To test the reliability of the accelerated storage test, dried suspensions of measles virus
were placed in water baths maintained at + 20 °C or + 15 °C or in low temperature
facilities at + 4 °C or —20 °C; The results obtained are shown in Table 4.
-
A comparison of the times requiredfor liquid.suspensions of measles virus in Medium
only to lose one log of titer at several temperatures of storage and the times predicted for
FREEZE-DRYING
In thepresent example, measles virus suspended in M199- plus Parke—Davis additive,
a straight—line graph was obtained when the log of k1 was plotted against the log of the
time required to lose one log of activity (Figure 4). The plotted relat10nsh1p allows one
to estimate the time required to lose one log of titer for a given value of k1 and by extensmu,
therefore, for a given temperature of storage. Because of problems of reproduction, one
log deck on the y—axis and one log deck on the x—axis have been deleted.
to
05
05
. EXPERIMENTÀL
2
OPREDICTED
28
o.:
.06
+ 2
C
.
_03
.ou
;
.ooe
.003
20
.001
.0003
.com
—
D‘)
‘0
°
O
O
O
O
O
O
°
O
O
—
I°
@
O
O
O
O
O
O
O
—
IO
(D
0
Q
0
Q
_
m
a!“
g
FOR 1 LOG LOSSIN TITER
(DAYS)
FIGURE 4. Plot of pseudo rst order rates of thermal degradation (ki) against the predicted time required for
1 log loss in titer (days). (Reprinted from the Jaurnal oflmmunology by permission of Williams and Wilkins,
Publishers.)
To test the reliability of the accelerated storage test, dried suspensions of measles virus
were placed in water baths maintained at + 20 °C or + 15 °C or in low temperature
facilities at + 4 °C or —20 °C; The results obtained are shown in Table 4.
-
A comparison of the times requiredfor liquid.suspensions of measles virus in Medium
only to lose one log of titer at several temperatures of storage and the times predicted for