

1 10
FREEZE-DRYING
€
where log yo is the log… of the initial titer, log y is the log… of the concentration at any
time (t) and the reaction rate (lq) is in units of loglo of t1ter per umt time.
One criterion found necessary for the selection of the temperatures used for accelerated
storage testing was that the di‘erences in the k1 value associated with each temperature
be statistically signicant. The temperatures used in the present studies fullled this requirement (see Appendix B or C).
'
5.0
.
28° 0
“
'
36.2° G
4.5
:_
A 45°C
,_
3.5
.
. .
Ë 3_o '
'
_
'
-
D
‘
LL
.
.
'
î
.
D25
'
.
î:
:
(D
«
.
,
0 ‘2.0
'
‘
'
_J
?
*:
L5
l—….
.
‘
.
|.0
‘
.
'
0
5
IO
IS
20
25
’
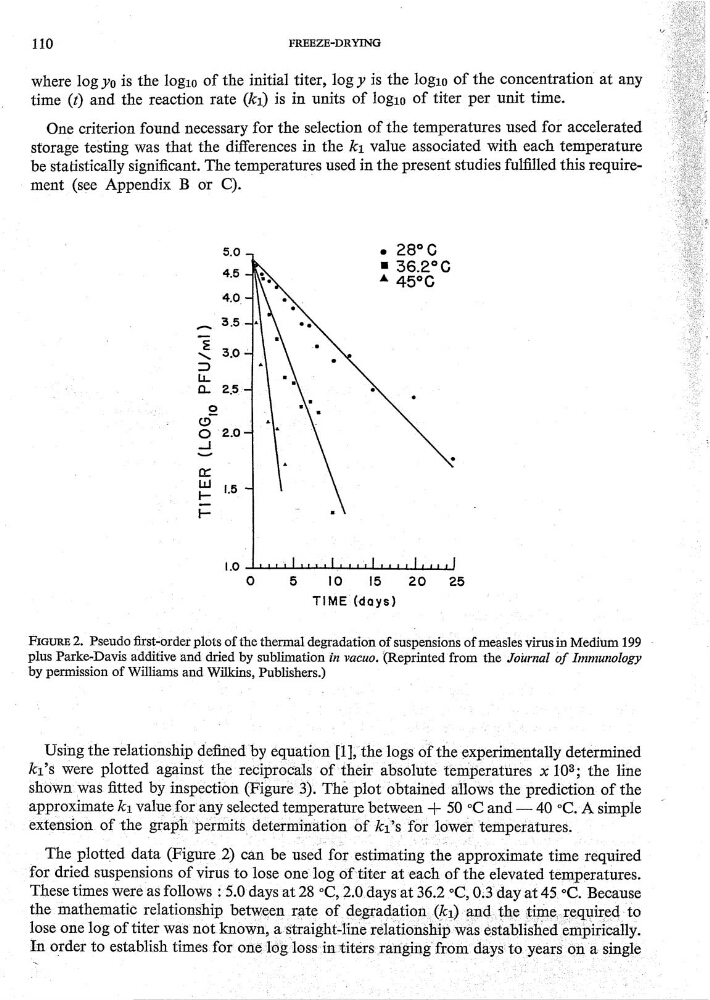
FIGURE 2. Pseudo rst—order plots of the thermal degradation of suspensions of measles virus in Medium 199 -
.
plus Parke—Davis additive and dried by sublimation în vacuo. (Reprinted from the Joùrnal of Immunology
by permission of Williams and Wilkins, Publishers.)
Using the relationship dened by equati0n [l], thelogs of the experimentay determined
k1’s were plotted against the rectiprocèüs “of “their absOlute temperatures x 103; the line
sh0‘Wn Was tted by inspection (Figure 3). Théplot bbtained “allows the prediction of the
approximate k1
any selected temperature between +
50 ÈC and -— 40 °C. A simple
extension of the graph “permits determination Of kl’s for lower temperatures.
'
_
The plotted data (Figure2) can be used for estimating the approximate time required
for dried suspensions of virus to lose one'log ofvtiter at each of the elevated temperatures.
These times were as follows 5.0 days at 28 °C, 2.0days at 36.2 °C,
at 45 °C. Because
the mathemati0 relationship between rate of degradation (kil) and the time required-to
lose one log of titer was not known,
relationship Was
In order to establish times for one log loss in titers ranging from‘days to-years on a single
FREEZE-DRYING
€
where log yo is the log… of the initial titer, log y is the log… of the concentration at any
time (t) and the reaction rate (lq) is in units of loglo of t1ter per umt time.
One criterion found necessary for the selection of the temperatures used for accelerated
storage testing was that the di‘erences in the k1 value associated with each temperature
be statistically signicant. The temperatures used in the present studies fullled this requirement (see Appendix B or C).
'
5.0
.
28° 0
“
'
36.2° G
4.5
:_
A 45°C
,_
3.5
.
. .
Ë 3_o '
'
_
'
-
D
‘
LL
.
.
'
î
.
D25
'
.
î:
:
(D
«
.
,
0 ‘2.0
'
‘
'
_J
?
*:
L5
l—….
.
‘
.
|.0
‘
.
'
0
5
IO
IS
20
25
’
FIGURE 2. Pseudo rst—order plots of the thermal degradation of suspensions of measles virus in Medium 199 -
.
plus Parke—Davis additive and dried by sublimation în vacuo. (Reprinted from the Joùrnal of Immunology
by permission of Williams and Wilkins, Publishers.)
Using the relationship dened by equati0n [l], thelogs of the experimentay determined
k1’s were plotted against the rectiprocèüs “of “their absOlute temperatures x 103; the line
sh0‘Wn Was tted by inspection (Figure 3). Théplot bbtained “allows the prediction of the
approximate k1
any selected temperature between +
50 ÈC and -— 40 °C. A simple
extension of the graph “permits determination Of kl’s for lower temperatures.
'
_
The plotted data (Figure2) can be used for estimating the approximate time required
for dried suspensions of virus to lose one'log ofvtiter at each of the elevated temperatures.
These times were as follows 5.0 days at 28 °C, 2.0days at 36.2 °C,
at 45 °C. Because
the mathemati0 relationship between rate of degradation (kil) and the time required-to
lose one log of titer was not known,
relationship Was
In order to establish times for one log loss in titers ranging from‘days to-years on a single