

THERMAL DEGRADAT‘ION on VIRUSES
109
were such that the limits of infectivity testing were reached in approximately 25 days at
the low temperature and in approximately 4 days at the high temperature. In liquid suspen—
sions, the low temperature used, based on empirical observation, was such that the time
required for a l logm loss in titer was approximately 25 days; the high temperature such
that the limit for infectivity testing was reached in approximately 10 days. Infectivity titers
were determined by plaque assay in a monolayer tissue culture system. A di”erence in
titers of 0.35 log between samples was found necessary for statistical signicance. The
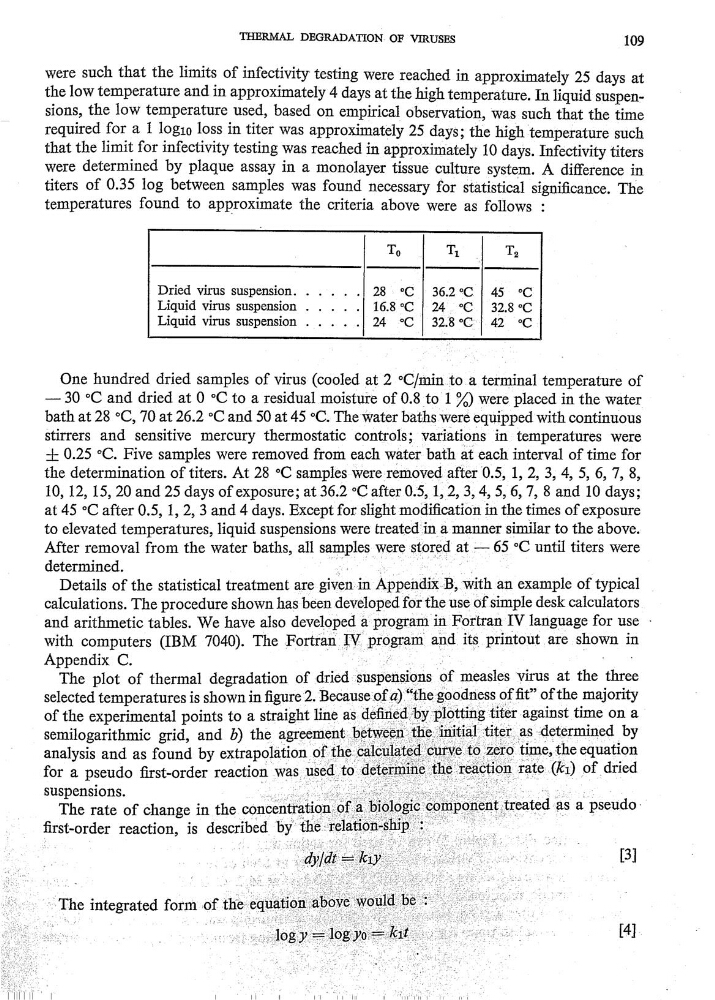
temperatures found to approximate the criteria above were as follows :
To
T1
_
T2
Dried virus suspension. . . . . .
28
°C
36.2 °C.
45
°C
Liquid virus suspension . . . . .
16.8 °C
24
°C
32.8 °C
Liquid virus suspension . . . . .
24
°C
32.8 °C} 42
°C
One hundred dried samples of virus (cooled at 2 °C/1hinto a terminal temperature of
——
30 °C and dried at 0 °C to a residual moistuiè of 0.8
%) were placed in the water
bath at 28 °C, 70 at 26.2 °C and 50 at 45 °C. The water bat—hs were equipped with continuous
stirrers and sensitive mercury thermostatic controls; variatiOns in temperatures were
:}; 0.25 °C. Five samples were removed from each Water bath at each interval of time for
the determination of titers. At 28 °C samples were;reihoved after 0.5, 1, 2, 3, 4, 5, 6, 7, 8,
10, 12, 15, 20 and 25 days of exposure; at 36.2 °C after 0.5, l, 2, 3, 4, 5, 6, 7, 8 and 10 days;
at 45 °C after 0.5, l, 2, 3 and 4 days. Except for slight modication in the times of exposure
to elevated temperatures, liquid suspensions were treaŒdina-manner similar to the above.
After removal from the water baths, all samples were stored at
65 °C until titers were
determined.
«
;
_”.
Details of the statistical treatment are giveninAppehdüî B, with an example of typical
_
calculations. The procedure shown has been developed fôr‘the use of simple desk calculators
and arithmetic tables. We have also developed a
IV language
for use -
With computers (IBM 7040). The =Fortran__I‘VJ program
its printoutare shown
in
Appendix C.
>‘Î"
The plot of thermal degradation of dried Suspensions of measles ”virus at the three
selected temperatures is shown in gure '2. ‘BeCause ofq)fff£he
_Qft”
Of the majority
'
of the experimental points to a straight line as denedbyplottmgüter against time on a
semilogarithmic grid, and b) the
‘
analysis and as found by extrapolatioupheCâÏCUÏaÏ€dCÜÏVËÏOZÔÏO
equation
for a pseudo rst—order reaction was usedtodt“£<ôl‘lîlnô111131‘€aCÜOHT2Vce (ki) Of
SUSPension&
,
…
:
>
—
The rate of change in the. concentration°fab‘°1°g‘°°°mP°n°nttœaŒdas & Pse“d°‘
rst—order reaction, is described bytherelaüoII—Shïp
_
_
:
“
The integrated form of theequaü°°°°V°w°“1dbe
,
‘“
”
'
Hu“… ‘
«
…
u
,
î‘
'
109
were such that the limits of infectivity testing were reached in approximately 25 days at
the low temperature and in approximately 4 days at the high temperature. In liquid suspen—
sions, the low temperature used, based on empirical observation, was such that the time
required for a l logm loss in titer was approximately 25 days; the high temperature such
that the limit for infectivity testing was reached in approximately 10 days. Infectivity titers
were determined by plaque assay in a monolayer tissue culture system. A di”erence in
titers of 0.35 log between samples was found necessary for statistical signicance. The
temperatures found to approximate the criteria above were as follows :
To
T1
_
T2
Dried virus suspension. . . . . .
28
°C
36.2 °C.
45
°C
Liquid virus suspension . . . . .
16.8 °C
24
°C
32.8 °C
Liquid virus suspension . . . . .
24
°C
32.8 °C} 42
°C
One hundred dried samples of virus (cooled at 2 °C/1hinto a terminal temperature of
——
30 °C and dried at 0 °C to a residual moistuiè of 0.8
%) were placed in the water
bath at 28 °C, 70 at 26.2 °C and 50 at 45 °C. The water bat—hs were equipped with continuous
stirrers and sensitive mercury thermostatic controls; variatiOns in temperatures were
:}; 0.25 °C. Five samples were removed from each Water bath at each interval of time for
the determination of titers. At 28 °C samples were;reihoved after 0.5, 1, 2, 3, 4, 5, 6, 7, 8,
10, 12, 15, 20 and 25 days of exposure; at 36.2 °C after 0.5, l, 2, 3, 4, 5, 6, 7, 8 and 10 days;
at 45 °C after 0.5, l, 2, 3 and 4 days. Except for slight modication in the times of exposure
to elevated temperatures, liquid suspensions were treaŒdina-manner similar to the above.
After removal from the water baths, all samples were stored at
65 °C until titers were
determined.
«
;
_”.
Details of the statistical treatment are giveninAppehdüî B, with an example of typical
_
calculations. The procedure shown has been developed fôr‘the use of simple desk calculators
and arithmetic tables. We have also developed a
IV language
for use -
With computers (IBM 7040). The =Fortran__I‘VJ program
its printoutare shown
in
Appendix C.
>‘Î"
The plot of thermal degradation of dried Suspensions of measles ”virus at the three
selected temperatures is shown in gure '2. ‘BeCause ofq)fff£he
_Qft”
Of the majority
'
of the experimental points to a straight line as denedbyplottmgüter against time on a
semilogarithmic grid, and b) the
‘
analysis and as found by extrapolatioupheCâÏCUÏaÏ€dCÜÏVËÏOZÔÏO
equation
for a pseudo rst—order reaction was usedtodt“£<ôl‘lîlnô111131‘€aCÜOHT2Vce (ki) Of
SUSPension&
,
…
:
>
—
The rate of change in the. concentration°fab‘°1°g‘°°°mP°n°nttœaŒdas & Pse“d°‘
rst—order reaction, is described bytherelaüoII—Shïp
_
_
:
“
The integrated form of theequaü°°°°V°w°“1dbe
,
‘“
”
'
Hu“… ‘
«
…
u
,
î‘
'