

454
Chapter 15 What’s Next for Geospatial Technology?
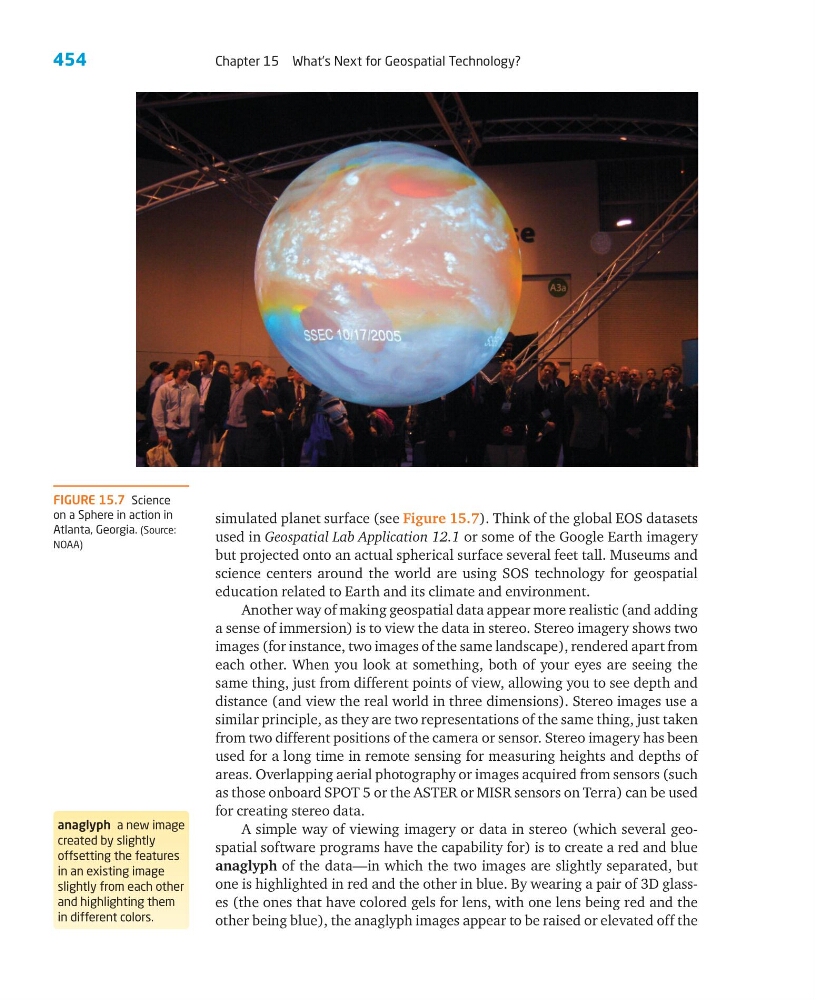
simulated planet surface (see Figure 15.7). Think of the global EOS datasets
used in Geospatial Lab Application 12.1 or some of the Google Earth imagery
but projected onto an actual spherical surface several feet tall. Museums and
science centers around the world are using SOS technology for geospatial
education related to Earth and its climate and environment.
Another way of making geospatial data appear more realistic (and adding
a sense of immersion) is to view the data in stereo. Stereo imagery shows two
images (for instance, two images of the same landscape), rendered apart from
each other. When you look at something, both of your eyes are seeing the
same thing, just from different points of view, allowing you to see depth and
distance (and view the real world in three dimensions). Stereo images use a
similar principle, as they are two representations of the same thing, just taken
from two different positions of the camera or sensor. Stereo imagery has been
used for a long time in remote sensing for measuring heights and depths of
areas. Overlapping aerial photography or images acquired from sensors (such
as those onboard SPOT 5 or the ASTER or MISR sensors on Terra) can be used
for creating stereo data.
A simple way of viewing imagery or data in stereo (which several geospatial software programs have the capability for) is to create a red and blue
anaglyph of the data—in which the two images are slightly separated, but
one is highlighted in red and the other in blue. By wearing a pair of 3D glasses (the ones that have colored gels for lens, with one lens being red and the
other being blue), the anaglyph images appear to be raised or elevated off the
FIGURE 15.7 Science
on a Sphere in action in
Atlanta, Georgia. (Source:
NOAA)
anaglyph a new image
created by slightly
offsetting the features
in an existing image
slightly from each other
and highlighting them
in different colors.
Chapter 15 What’s Next for Geospatial Technology?
simulated planet surface (see Figure 15.7). Think of the global EOS datasets
used in Geospatial Lab Application 12.1 or some of the Google Earth imagery
but projected onto an actual spherical surface several feet tall. Museums and
science centers around the world are using SOS technology for geospatial
education related to Earth and its climate and environment.
Another way of making geospatial data appear more realistic (and adding
a sense of immersion) is to view the data in stereo. Stereo imagery shows two
images (for instance, two images of the same landscape), rendered apart from
each other. When you look at something, both of your eyes are seeing the
same thing, just from different points of view, allowing you to see depth and
distance (and view the real world in three dimensions). Stereo images use a
similar principle, as they are two representations of the same thing, just taken
from two different positions of the camera or sensor. Stereo imagery has been
used for a long time in remote sensing for measuring heights and depths of
areas. Overlapping aerial photography or images acquired from sensors (such
as those onboard SPOT 5 or the ASTER or MISR sensors on Terra) can be used
for creating stereo data.
A simple way of viewing imagery or data in stereo (which several geospatial software programs have the capability for) is to create a red and blue
anaglyph of the data—in which the two images are slightly separated, but
one is highlighted in red and the other in blue. By wearing a pair of 3D glasses (the ones that have colored gels for lens, with one lens being red and the
other being blue), the anaglyph images appear to be raised or elevated off the
FIGURE 15.7 Science
on a Sphere in action in
Atlanta, Georgia. (Source:
NOAA)
anaglyph a new image
created by slightly
offsetting the features
in an existing image
slightly from each other
and highlighting them
in different colors.