

399
Digital Terrain Analysis
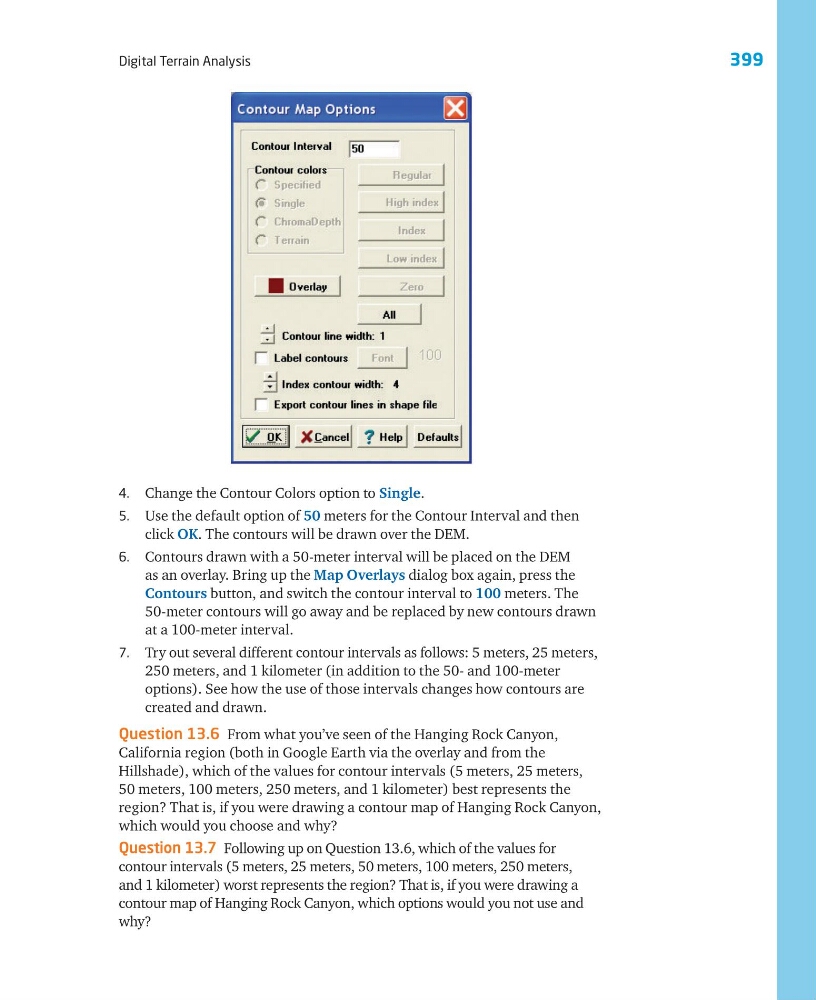
4. Change the Contour Colors option to Single.
5. Use the default option of 50 meters for the Contour Interval and then
click OK. The contours will be drawn over the DEM.
6. Contours drawn with a 50-meter interval will be placed on the DEM
as an overlay. Bring up the Map Overlays dialog box again, press the
Contours button, and switch the contour interval to 100 meters. The
50-meter contours will go away and be replaced by new contours drawn
at a 100-meter interval.
7. Try out several different contour intervals as follows: 5 meters, 25 meters,
250 meters, and 1 kilometer (in addition to the 50- and 100-meter
options). See how the use of those intervals changes how contours are
created and drawn.
Question 13.6 From what you’ve seen of the Hanging Rock Canyon,
California region (both in Google Earth via the overlay and from the
Hillshade), which of the values for contour intervals (5 meters, 25 meters,
50 meters, 100 meters, 250 meters, and 1 kilometer) best represents the
region? That is, if you were drawing a contour map of Hanging Rock Canyon,
which would you choose and why?
Question 13.7 Following up on Question 13.6, which of the values for
contour intervals (5 meters, 25 meters, 50 meters, 100 meters, 250 meters,
and 1 kilometer) worst represents the region? That is, if you were drawing a
contour map of Hanging Rock Canyon, which options would you not use and
why?
Digital Terrain Analysis
4. Change the Contour Colors option to Single.
5. Use the default option of 50 meters for the Contour Interval and then
click OK. The contours will be drawn over the DEM.
6. Contours drawn with a 50-meter interval will be placed on the DEM
as an overlay. Bring up the Map Overlays dialog box again, press the
Contours button, and switch the contour interval to 100 meters. The
50-meter contours will go away and be replaced by new contours drawn
at a 100-meter interval.
7. Try out several different contour intervals as follows: 5 meters, 25 meters,
250 meters, and 1 kilometer (in addition to the 50- and 100-meter
options). See how the use of those intervals changes how contours are
created and drawn.
Question 13.6 From what you’ve seen of the Hanging Rock Canyon,
California region (both in Google Earth via the overlay and from the
Hillshade), which of the values for contour intervals (5 meters, 25 meters,
50 meters, 100 meters, 250 meters, and 1 kilometer) best represents the
region? That is, if you were drawing a contour map of Hanging Rock Canyon,
which would you choose and why?
Question 13.7 Following up on Question 13.6, which of the values for
contour intervals (5 meters, 25 meters, 50 meters, 100 meters, 250 meters,
and 1 kilometer) worst represents the region? That is, if you were drawing a
contour map of Hanging Rock Canyon, which options would you not use and
why?