

398
Chapter 13 Digital Landscaping
Question 13.4 What time of day and Sun conditions do these values for
Sun azimuth and Sun elevation simulate? Why?
5. Return to the Reflectance Map Options. Test out the effect of other
hillshade visualizations based on some other Sun azimuth and Sun
elevation values. Answer Question 13.5. When you’re done, return to
the norm of Sun azimuth = 335 and Sun elevation of 45.
Question 13.5 What values for Sun azimuth and Sun elevation would
simulate a “sunset” viewing appearance of the DEM? Why?
13.6 Contour Lines and Contour Interval on a DEM
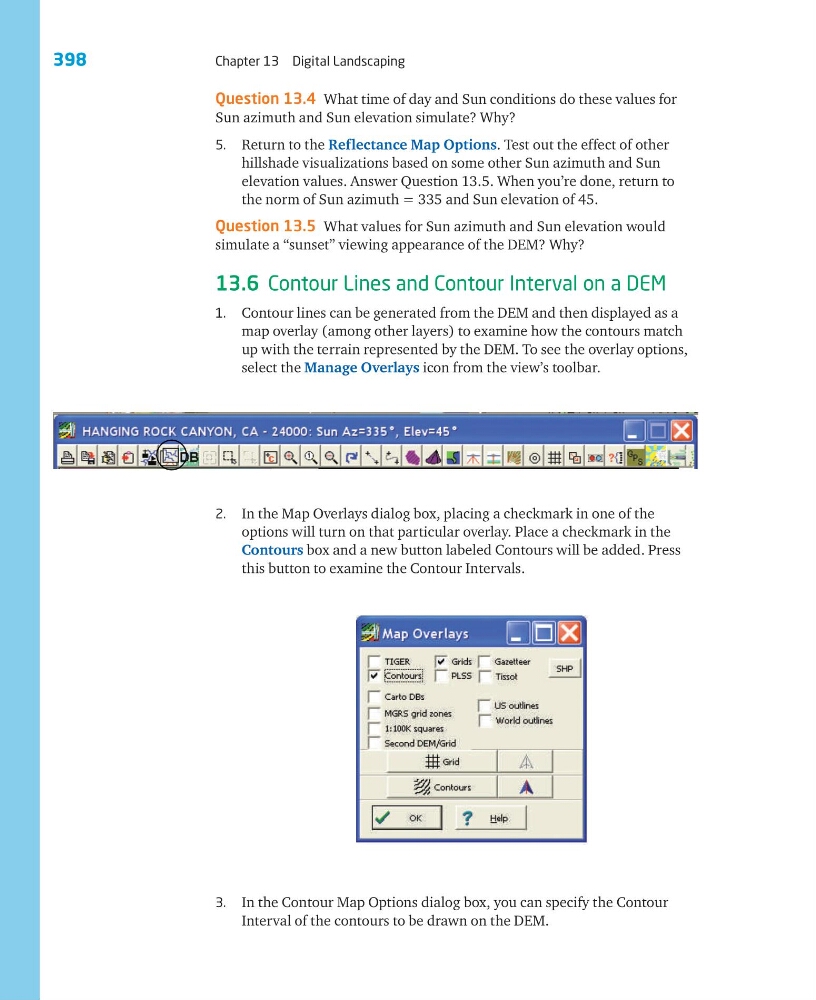
1. Contour lines can be generated from the DEM and then displayed as a
map overlay (among other layers) to examine how the contours match
up with the terrain represented by the DEM. To see the overlay options,
select the Manage Overlays icon from the view’s toolbar.
2. In the Map Overlays dialog box, placing a checkmark in one of the
options will turn on that particular overlay. Place a checkmark in the
Contours box and a new button labeled Contours will be added. Press
this button to examine the Contour Intervals.
3. In the Contour Map Options dialog box, you can specify the Contour
Interval of the contours to be drawn on the DEM.
Chapter 13 Digital Landscaping
Question 13.4 What time of day and Sun conditions do these values for
Sun azimuth and Sun elevation simulate? Why?
5. Return to the Reflectance Map Options. Test out the effect of other
hillshade visualizations based on some other Sun azimuth and Sun
elevation values. Answer Question 13.5. When you’re done, return to
the norm of Sun azimuth = 335 and Sun elevation of 45.
Question 13.5 What values for Sun azimuth and Sun elevation would
simulate a “sunset” viewing appearance of the DEM? Why?
13.6 Contour Lines and Contour Interval on a DEM
1. Contour lines can be generated from the DEM and then displayed as a
map overlay (among other layers) to examine how the contours match
up with the terrain represented by the DEM. To see the overlay options,
select the Manage Overlays icon from the view’s toolbar.
2. In the Map Overlays dialog box, placing a checkmark in one of the
options will turn on that particular overlay. Place a checkmark in the
Contours box and a new button labeled Contours will be added. Press
this button to examine the Contour Intervals.
3. In the Contour Map Options dialog box, you can specify the Contour
Interval of the contours to be drawn on the DEM.