

375
Earth Observing System Imagery
7. Rotate Google Earth to examine the MOPITT imagery draped over the
globe.
Question 12.8 Where (geographically) were the highest concentrations of
carbon monoxide in October 2010?
8. Back on the NEO Website, select the Energy tab, then select Land/
Surface temperature (Day) MODIS.
9. Choose the image for September 1, 2010–October 1, 2010.
10. Choose to Open this composite image in Google Earth.
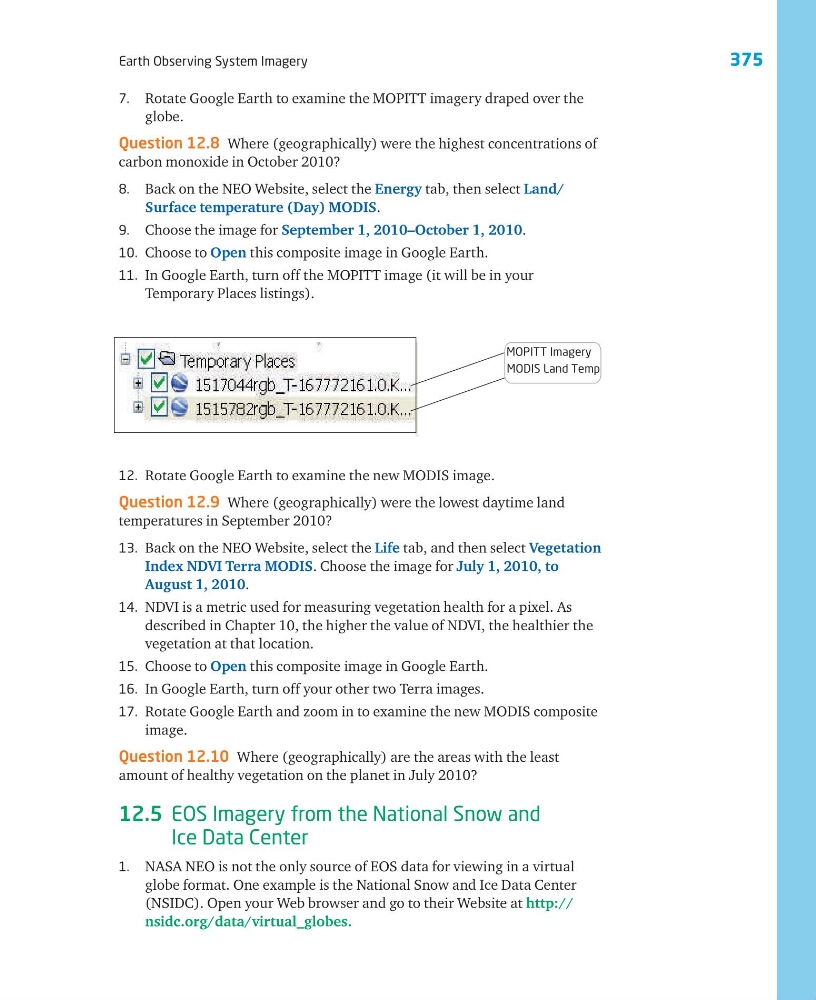
11. In Google Earth, turn off the MOPITT image (it will be in your
Temporary Places listings).
12. Rotate Google Earth to examine the new MODIS image.
Question 12.9 Where (geographically) were the lowest daytime land
temperatures in September 2010?
13. Back on the NEO Website, select the Life tab, and then select Vegetation
Index NDVI Terra MODIS. Choose the image for July 1, 2010, to
August 1, 2010.
14. NDVI is a metric used for measuring vegetation health for a pixel. As
described in Chapter 10, the higher the value of NDVI, the healthier the
vegetation at that location.
15. Choose to Open this composite image in Google Earth.
16. In Google Earth, turn off your other two Terra images.
17. Rotate Google Earth and zoom in to examine the new MODIS composite
image.
Question 12.10 Where (geographically) are the areas with the least
amount of healthy vegetation on the planet in July 2010?
12.5 EOS Imagery from the National Snow and
Ice Data Center
1. NASA NEO is not the only source of EOS data for viewing in a virtual
globe format. One example is the National Snow and Ice Data Center
(NSIDC). Open your Web browser and go to their Website at http://
nsidc.org/data/virtual_globes.
MOPITT Imagery
MODIS Land Temp
Earth Observing System Imagery
7. Rotate Google Earth to examine the MOPITT imagery draped over the
globe.
Question 12.8 Where (geographically) were the highest concentrations of
carbon monoxide in October 2010?
8. Back on the NEO Website, select the Energy tab, then select Land/
Surface temperature (Day) MODIS.
9. Choose the image for September 1, 2010–October 1, 2010.
10. Choose to Open this composite image in Google Earth.
11. In Google Earth, turn off the MOPITT image (it will be in your
Temporary Places listings).
12. Rotate Google Earth to examine the new MODIS image.
Question 12.9 Where (geographically) were the lowest daytime land
temperatures in September 2010?
13. Back on the NEO Website, select the Life tab, and then select Vegetation
Index NDVI Terra MODIS. Choose the image for July 1, 2010, to
August 1, 2010.
14. NDVI is a metric used for measuring vegetation health for a pixel. As
described in Chapter 10, the higher the value of NDVI, the healthier the
vegetation at that location.
15. Choose to Open this composite image in Google Earth.
16. In Google Earth, turn off your other two Terra images.
17. Rotate Google Earth and zoom in to examine the new MODIS composite
image.
Question 12.10 Where (geographically) are the areas with the least
amount of healthy vegetation on the planet in July 2010?
12.5 EOS Imagery from the National Snow and
Ice Data Center
1. NASA NEO is not the only source of EOS data for viewing in a virtual
globe format. One example is the National Snow and Ice Data Center
(NSIDC). Open your Web browser and go to their Website at http://
nsidc.org/data/virtual_globes.
MOPITT Imagery
MODIS Land Temp