

193
How Is Data Displayed on a GIS Map?
graduated symbols
the use of different
sized symbology
to convey thematic
information on a map.
choropleth map
a type of thematic
map in which data is
displayed according to
one of several different
classifications.
data classification
various methods used
for grouping together
(and displaying) values
on a choropleth map.
Natural Breaks a data
classification method
that selects class break
levels by searching
for spaces in the data
values.
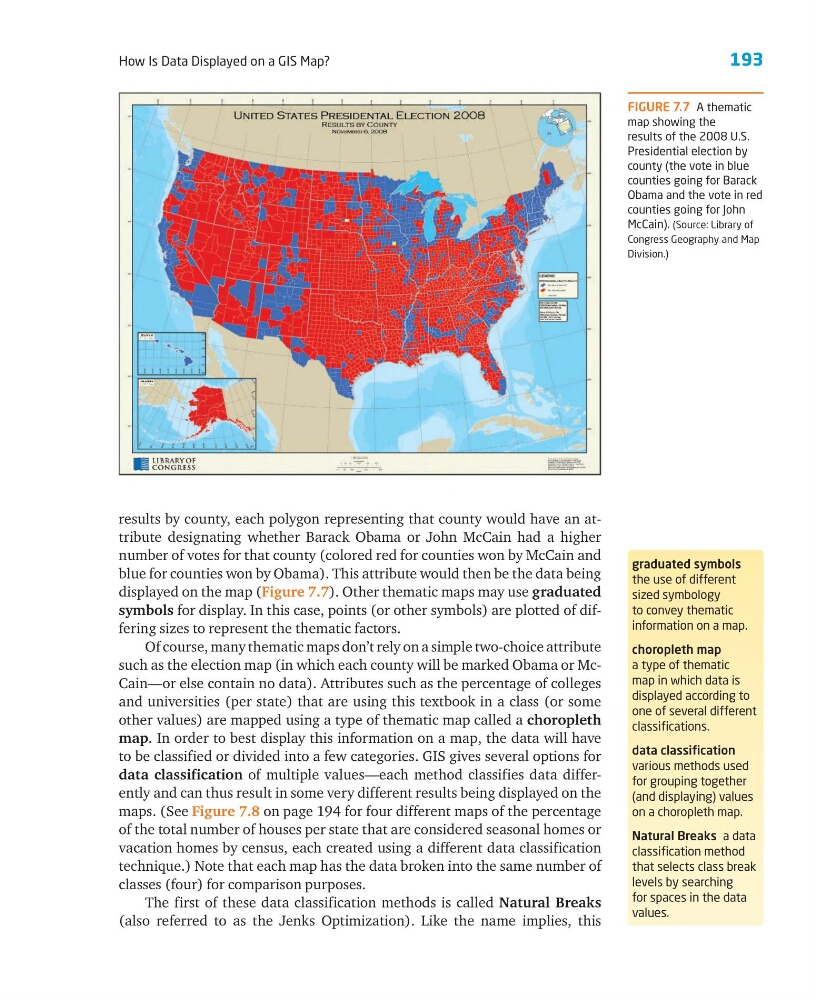
FIGURE 7.7 A thematic
map showing the
results of the 2008 U.S.
Presidential election by
county (the vote in blue
counties going for Barack
Obama and the vote in red
counties going for John
McCain). (Source: Library of
Congress Geography and Map
Division.)
results by county, each polygon representing that county would have an attribute designating whether Barack Obama or John McCain had a higher
number of votes for that county (colored red for counties won by McCain and
blue for counties won by Obama). This attribute would then be the data being
displayed on the map (Figure 7.7). Other thematic maps may use graduated
symbols for display. In this case, points (or other symbols) are plotted of differing sizes to represent the thematic factors.
Of course, many thematic maps don’t rely on a simple two-choice attribute
such as the election map (in which each county will be marked Obama or McCain—or else contain no data). Attributes such as the percentage of colleges
and universities (per state) that are using this textbook in a class (or some
other values) are mapped using a type of thematic map called a choropleth
map. In order to best display this information on a map, the data will have
to be classified or divided into a few categories. GIS gives several options for
data classification of multiple values—each method classifies data differently and can thus result in some very different results being displayed on the
maps. (See Figure 7.8 on page 194 for four different maps of the percentage
of the total number of houses per state that are considered seasonal homes or
vacation homes by census, each created using a different data classification
technique.) Note that each map has the data broken into the same number of
classes (four) for comparison purposes.
The first of these data classification methods is called Natural Breaks
(also referred to as the Jenks Optimization). Like the name implies, this
How Is Data Displayed on a GIS Map?
graduated symbols
the use of different
sized symbology
to convey thematic
information on a map.
choropleth map
a type of thematic
map in which data is
displayed according to
one of several different
classifications.
data classification
various methods used
for grouping together
(and displaying) values
on a choropleth map.
Natural Breaks a data
classification method
that selects class break
levels by searching
for spaces in the data
values.
FIGURE 7.7 A thematic
map showing the
results of the 2008 U.S.
Presidential election by
county (the vote in blue
counties going for Barack
Obama and the vote in red
counties going for John
McCain). (Source: Library of
Congress Geography and Map
Division.)
results by county, each polygon representing that county would have an attribute designating whether Barack Obama or John McCain had a higher
number of votes for that county (colored red for counties won by McCain and
blue for counties won by Obama). This attribute would then be the data being
displayed on the map (Figure 7.7). Other thematic maps may use graduated
symbols for display. In this case, points (or other symbols) are plotted of differing sizes to represent the thematic factors.
Of course, many thematic maps don’t rely on a simple two-choice attribute
such as the election map (in which each county will be marked Obama or McCain—or else contain no data). Attributes such as the percentage of colleges
and universities (per state) that are using this textbook in a class (or some
other values) are mapped using a type of thematic map called a choropleth
map. In order to best display this information on a map, the data will have
to be classified or divided into a few categories. GIS gives several options for
data classification of multiple values—each method classifies data differently and can thus result in some very different results being displayed on the
maps. (See Figure 7.8 on page 194 for four different maps of the percentage
of the total number of houses per state that are considered seasonal homes or
vacation homes by census, each created using a different data classification
technique.) Note that each map has the data broken into the same number of
classes (four) for comparison purposes.
The first of these data classification methods is called Natural Breaks
(also referred to as the Jenks Optimization). Like the name implies, this