

160
Chapter 6 Using GIS for Spatial Analysis
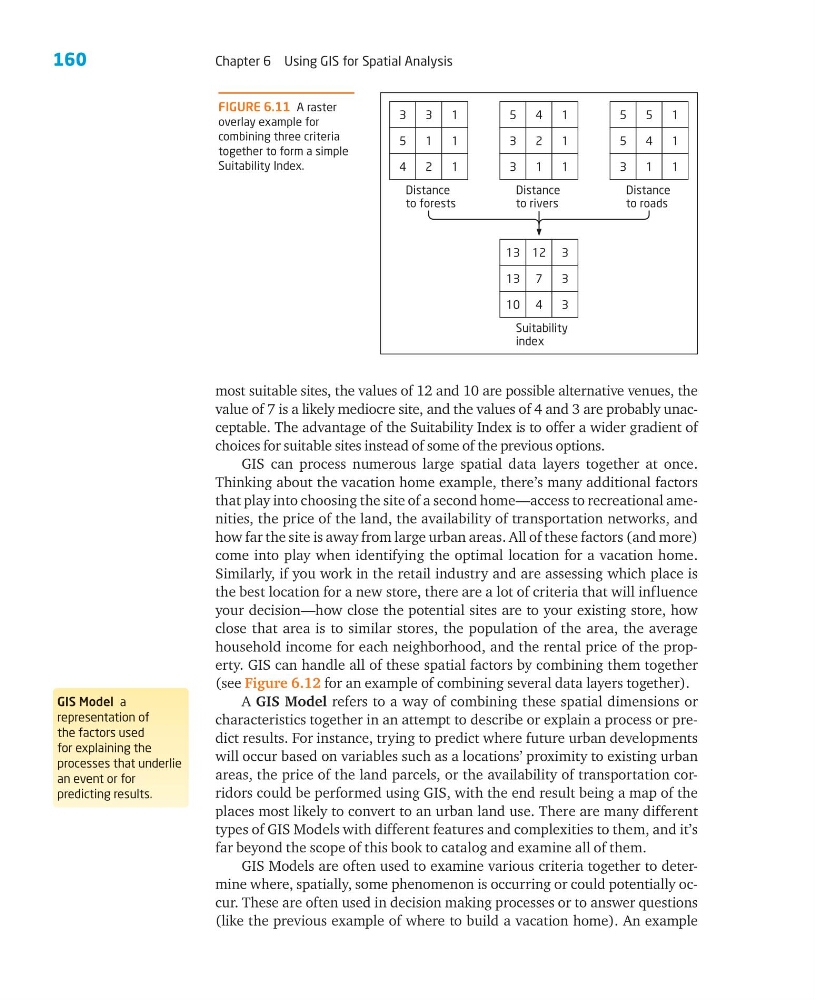
most suitable sites, the values of 12 and 10 are possible alternative venues, the
value of 7 is a likely mediocre site, and the values of 4 and 3 are probably unacceptable. The advantage of the Suitability Index is to offer a wider gradient of
choices for suitable sites instead of some of the previous options.
GIS can process numerous large spatial data layers together at once.
Thinking about the vacation home example, there’s many additional factors
that play into choosing the site of a second home—access to recreational amenities, the price of the land, the availability of transportation networks, and
how far the site is away from large urban areas. All of these factors (and more)
come into play when identifying the optimal location for a vacation home.
Similarly, if you work in the retail industry and are assessing which place is
the best location for a new store, there are a lot of criteria that will influence
your decision—how close the potential sites are to your existing store, how
close that area is to similar stores, the population of the area, the average
household income for each neighborhood, and the rental price of the property. GIS can handle all of these spatial factors by combining them together
(see Figure 6.12 for an example of combining several data layers together).
A GIS Model refers to a way of combining these spatial dimensions or
characteristics together in an attempt to describe or explain a process or predict results. For instance, trying to predict where future urban developments
will occur based on variables such as a locations’ proximity to existing urban
areas, the price of the land parcels, or the availability of transportation corridors could be performed using GIS, with the end result being a map of the
places most likely to convert to an urban land use. There are many different
types of GIS Models with different features and complexities to them, and it’s
far beyond the scope of this book to catalog and examine all of them.
GIS Models are often used to examine various criteria together to determine where, spatially, some phenomenon is occurring or could potentially occur. These are often used in decision making processes or to answer questions
(like the previous example of where to build a vacation home). An example
3
3
1
5
1
1
4
2
Distance
to forests
1
5
4
1
3
2
1
3
1
Distance
to rivers
1
13 12 3
13 7
3
10 4
Suitability
index
3
5
5
1
5
4
1
3
1
Distance
to roads
1
FIGURE 6.11 A raster
overlay example for
combining three criteria
together to form a simple
Suitability Index.
GIS Model a
representation of
the factors used
for explaining the
processes that underlie
an event or for
predicting results.
Chapter 6 Using GIS for Spatial Analysis
most suitable sites, the values of 12 and 10 are possible alternative venues, the
value of 7 is a likely mediocre site, and the values of 4 and 3 are probably unacceptable. The advantage of the Suitability Index is to offer a wider gradient of
choices for suitable sites instead of some of the previous options.
GIS can process numerous large spatial data layers together at once.
Thinking about the vacation home example, there’s many additional factors
that play into choosing the site of a second home—access to recreational amenities, the price of the land, the availability of transportation networks, and
how far the site is away from large urban areas. All of these factors (and more)
come into play when identifying the optimal location for a vacation home.
Similarly, if you work in the retail industry and are assessing which place is
the best location for a new store, there are a lot of criteria that will influence
your decision—how close the potential sites are to your existing store, how
close that area is to similar stores, the population of the area, the average
household income for each neighborhood, and the rental price of the property. GIS can handle all of these spatial factors by combining them together
(see Figure 6.12 for an example of combining several data layers together).
A GIS Model refers to a way of combining these spatial dimensions or
characteristics together in an attempt to describe or explain a process or predict results. For instance, trying to predict where future urban developments
will occur based on variables such as a locations’ proximity to existing urban
areas, the price of the land parcels, or the availability of transportation corridors could be performed using GIS, with the end result being a map of the
places most likely to convert to an urban land use. There are many different
types of GIS Models with different features and complexities to them, and it’s
far beyond the scope of this book to catalog and examine all of them.
GIS Models are often used to examine various criteria together to determine where, spatially, some phenomenon is occurring or could potentially occur. These are often used in decision making processes or to answer questions
(like the previous example of where to build a vacation home). An example
3
3
1
5
1
1
4
2
Distance
to forests
1
5
4
1
3
2
1
3
1
Distance
to rivers
1
13 12 3
13 7
3
10 4
Suitability
index
3
5
5
1
5
4
1
3
1
Distance
to roads
1
FIGURE 6.11 A raster
overlay example for
combining three criteria
together to form a simple
Suitability Index.
GIS Model a
representation of
the factors used
for explaining the
processes that underlie
an event or for
predicting results.