

159
How Can Multiple Types of Spatial Analysis Operations Be Performed in GIS?
you may want to know the distance that spot is from a landfill or waste-water
treatment plant. Alternatively, you may want to know the distance a vacation home is away from a lake or river. A way of conceptualizing distance (as
is done in ArcGIS) is to think of it has a continuous surface (see Chapter 5),
where each spot on that surface is has a value for the distance it is away from a
feature. ArcGIS makes these measurements by calculating a distance surface
of raster grid cells, with each cell containing a value of the distance from the
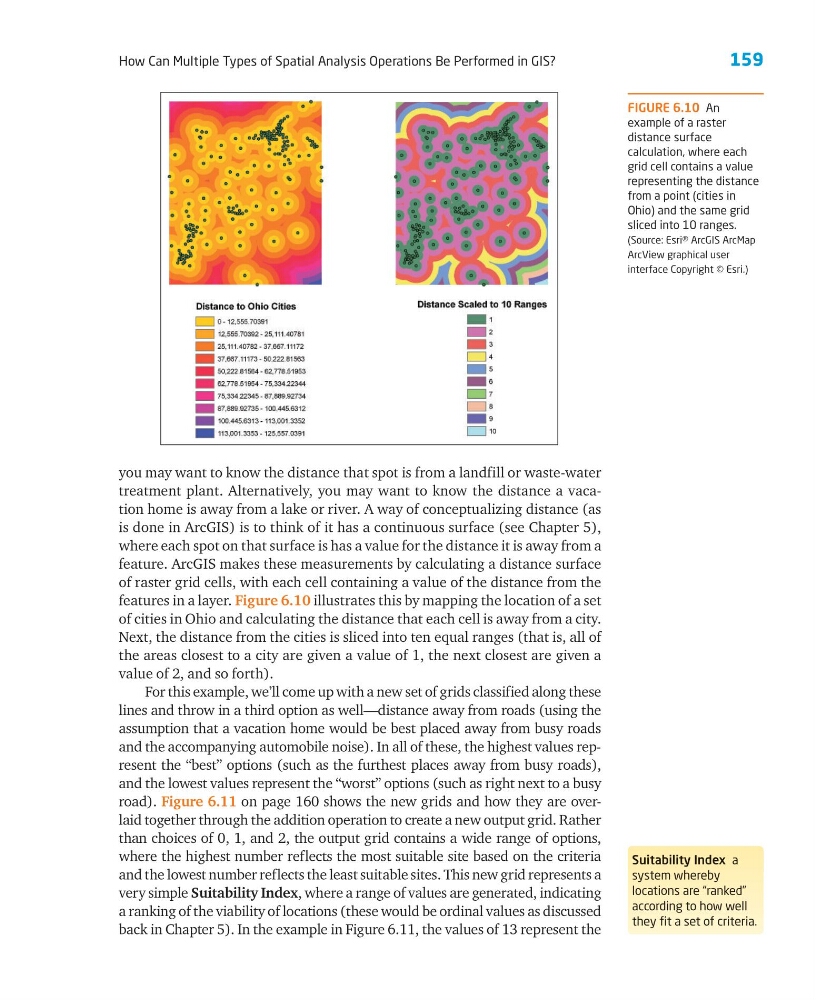
features in a layer. Figure 6.10 illustrates this by mapping the location of a set
of cities in Ohio and calculating the distance that each cell is away from a city.
Next, the distance from the cities is sliced into ten equal ranges (that is, all of
the areas closest to a city are given a value of 1, the next closest are given a
value of 2, and so forth).
For this example, we’ll come up with a new set of grids classified along these
lines and throw in a third option as well—distance away from roads (using the
assumption that a vacation home would be best placed away from busy roads
and the accompanying automobile noise). In all of these, the highest values represent the “best” options (such as the furthest places away from busy roads),
and the lowest values represent the “worst” options (such as right next to a busy
road). Figure 6.11 on page 160 shows the new grids and how they are overlaid together through the addition operation to create a new output grid. Rather
than choices of 0, 1, and 2, the output grid contains a wide range of options,
where the highest number reflects the most suitable site based on the criteria
and the lowest number reflects the least suitable sites. This new grid represents a
very simple Suitability Index, where a range of values are generated, indicating
a ranking of the viability of locations (these would be ordinal values as discussed
back in Chapter 5). In the example in Figure 6.11, the values of 13 represent the
FIGURE 6.10 An
example of a raster
distance surface
calculation, where each
grid cell contains a value
representing the distance
from a point (cities in
Ohio) and the same grid
sliced into 10 ranges.
(Source: Esri® ArcGIS ArcMap
ArcView graphical user
interface Copyright © Esri.)
Suitability Index a
system whereby
locations are “ranked”
according to how well
they fit a set of criteria.
How Can Multiple Types of Spatial Analysis Operations Be Performed in GIS?
you may want to know the distance that spot is from a landfill or waste-water
treatment plant. Alternatively, you may want to know the distance a vacation home is away from a lake or river. A way of conceptualizing distance (as
is done in ArcGIS) is to think of it has a continuous surface (see Chapter 5),
where each spot on that surface is has a value for the distance it is away from a
feature. ArcGIS makes these measurements by calculating a distance surface
of raster grid cells, with each cell containing a value of the distance from the
features in a layer. Figure 6.10 illustrates this by mapping the location of a set
of cities in Ohio and calculating the distance that each cell is away from a city.
Next, the distance from the cities is sliced into ten equal ranges (that is, all of
the areas closest to a city are given a value of 1, the next closest are given a
value of 2, and so forth).
For this example, we’ll come up with a new set of grids classified along these
lines and throw in a third option as well—distance away from roads (using the
assumption that a vacation home would be best placed away from busy roads
and the accompanying automobile noise). In all of these, the highest values represent the “best” options (such as the furthest places away from busy roads),
and the lowest values represent the “worst” options (such as right next to a busy
road). Figure 6.11 on page 160 shows the new grids and how they are overlaid together through the addition operation to create a new output grid. Rather
than choices of 0, 1, and 2, the output grid contains a wide range of options,
where the highest number reflects the most suitable site based on the criteria
and the lowest number reflects the least suitable sites. This new grid represents a
very simple Suitability Index, where a range of values are generated, indicating
a ranking of the viability of locations (these would be ordinal values as discussed
back in Chapter 5). In the example in Figure 6.11, the values of 13 represent the
FIGURE 6.10 An
example of a raster
distance surface
calculation, where each
grid cell contains a value
representing the distance
from a point (cities in
Ohio) and the same grid
sliced into 10 ranges.
(Source: Esri® ArcGIS ArcMap
ArcView graphical user
interface Copyright © Esri.)
Suitability Index a
system whereby
locations are “ranked”
according to how well
they fit a set of criteria.