

157
How Can You Perform Basic Spatial Analysis in GIS?
when the desired criteria are not met. Thus, grids could be designed using
this system with values of 0 or 1 to reflect whether a grid cell meets or does
not meet particular criteria.
Let’s start with a simplified example—say you’re looking to find a plot of
land to build a vacation home on, and your two key criteria are that it be close
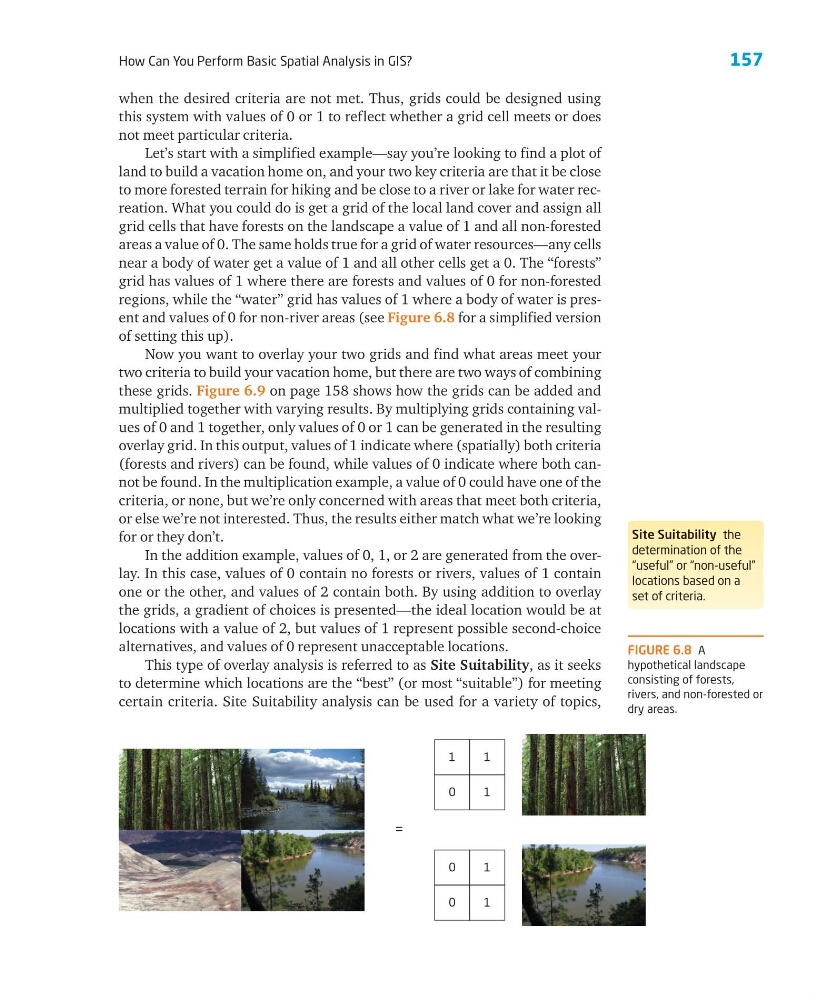
to more forested terrain for hiking and be close to a river or lake for water recreation. What you could do is get a grid of the local land cover and assign all
grid cells that have forests on the landscape a value of 1 and all non-forested
areas a value of 0. The same holds true for a grid of water resources—any cells
near a body of water get a value of 1 and all other cells get a 0. The “forests”
grid has values of 1 where there are forests and values of 0 for non-forested
regions, while the “water” grid has values of 1 where a body of water is present and values of 0 for non-river areas (see Figure 6.8 for a simplified version
of setting this up).
Now you want to overlay your two grids and find what areas meet your
two criteria to build your vacation home, but there are two ways of combining
these grids. Figure 6.9 on page 158 shows how the grids can be added and
multiplied together with varying results. By multiplying grids containing values of 0 and 1 together, only values of 0 or 1 can be generated in the resulting
overlay grid. In this output, values of 1 indicate where (spatially) both criteria
(forests and rivers) can be found, while values of 0 indicate where both cannot be found. In the multiplication example, a value of 0 could have one of the
criteria, or none, but we’re only concerned with areas that meet both criteria,
or else we’re not interested. Thus, the results either match what we’re looking
for or they don’t.
In the addition example, values of 0, 1, or 2 are generated from the overlay. In this case, values of 0 contain no forests or rivers, values of 1 contain
one or the other, and values of 2 contain both. By using addition to overlay
the grids, a gradient of choices is presented—the ideal location would be at
locations with a value of 2, but values of 1 represent possible second-choice
alternatives, and values of 0 represent unacceptable locations.
This type of overlay analysis is referred to as Site Suitability, as it seeks
to determine which locations are the “best” (or most “suitable”) for meeting
certain criteria. Site Suitability analysis can be used for a variety of topics,
1
1
0
1
=
0
1
0
1
FIGURE 6.8 A
hypothetical landscape
consisting of forests,
rivers, and non-forested or
dry areas.
Site Suitability the
determination of the
“useful” or “non-useful”
locations based on a
set of criteria.
How Can You Perform Basic Spatial Analysis in GIS?
when the desired criteria are not met. Thus, grids could be designed using
this system with values of 0 or 1 to reflect whether a grid cell meets or does
not meet particular criteria.
Let’s start with a simplified example—say you’re looking to find a plot of
land to build a vacation home on, and your two key criteria are that it be close
to more forested terrain for hiking and be close to a river or lake for water recreation. What you could do is get a grid of the local land cover and assign all
grid cells that have forests on the landscape a value of 1 and all non-forested
areas a value of 0. The same holds true for a grid of water resources—any cells
near a body of water get a value of 1 and all other cells get a 0. The “forests”
grid has values of 1 where there are forests and values of 0 for non-forested
regions, while the “water” grid has values of 1 where a body of water is present and values of 0 for non-river areas (see Figure 6.8 for a simplified version
of setting this up).
Now you want to overlay your two grids and find what areas meet your
two criteria to build your vacation home, but there are two ways of combining
these grids. Figure 6.9 on page 158 shows how the grids can be added and
multiplied together with varying results. By multiplying grids containing values of 0 and 1 together, only values of 0 or 1 can be generated in the resulting
overlay grid. In this output, values of 1 indicate where (spatially) both criteria
(forests and rivers) can be found, while values of 0 indicate where both cannot be found. In the multiplication example, a value of 0 could have one of the
criteria, or none, but we’re only concerned with areas that meet both criteria,
or else we’re not interested. Thus, the results either match what we’re looking
for or they don’t.
In the addition example, values of 0, 1, or 2 are generated from the overlay. In this case, values of 0 contain no forests or rivers, values of 1 contain
one or the other, and values of 2 contain both. By using addition to overlay
the grids, a gradient of choices is presented—the ideal location would be at
locations with a value of 2, but values of 1 represent possible second-choice
alternatives, and values of 0 represent unacceptable locations.
This type of overlay analysis is referred to as Site Suitability, as it seeks
to determine which locations are the “best” (or most “suitable”) for meeting
certain criteria. Site Suitability analysis can be used for a variety of topics,
1
1
0
1
=
0
1
0
1
FIGURE 6.8 A
hypothetical landscape
consisting of forests,
rivers, and non-forested or
dry areas.
Site Suitability the
determination of the
“useful” or “non-useful”
locations based on a
set of criteria.