

143
GIS Introduction: ArcGIS Version
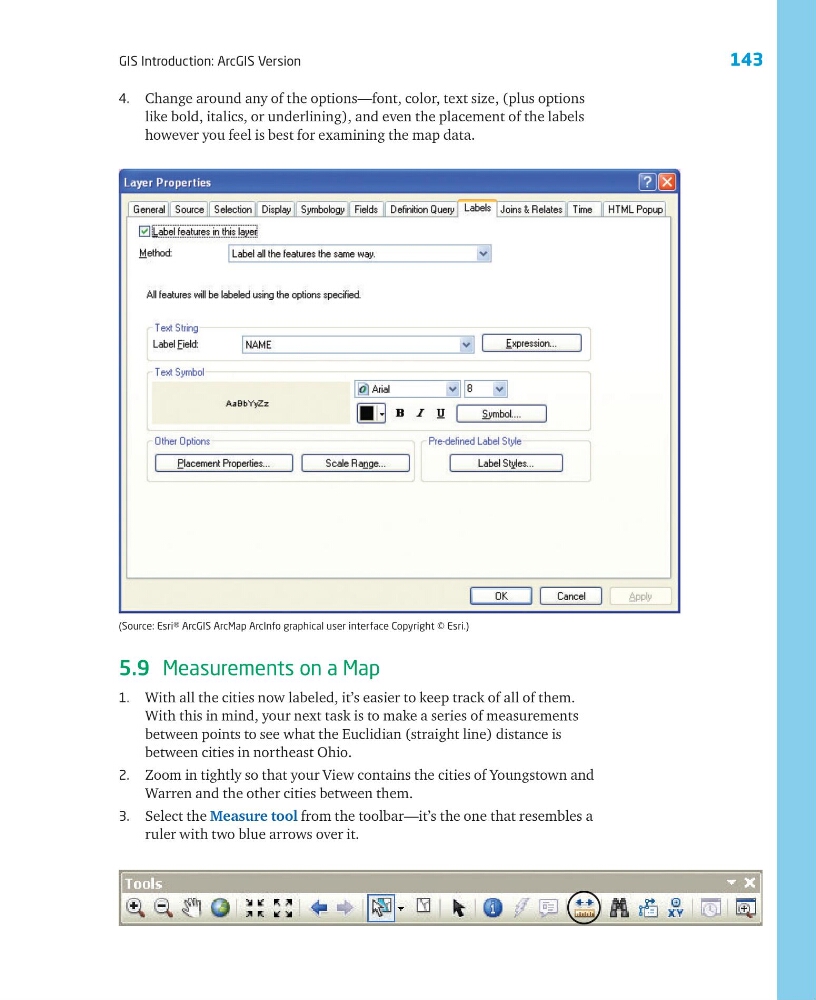
4. Change around any of the options—font, color, text size, (plus options
like bold, italics, or underlining), and even the placement of the labels
however you feel is best for examining the map data.
5.9 Measurements on a Map
1. With all the cities now labeled, it’s easier to keep track of all of them.
With this in mind, your next task is to make a series of measurements
between points to see what the Euclidian (straight line) distance is
between cities in northeast Ohio.
2. Zoom in tightly so that your View contains the cities of Youngstown and
Warren and the other cities between them.
3. Select the Measure tool from the toolbar—it’s the one that resembles a
ruler with two blue arrows over it.
(Source: Esri® ArcGIS ArcMap ArcInfo graphical user interface Copyright © Esri.)
GIS Introduction: ArcGIS Version
4. Change around any of the options—font, color, text size, (plus options
like bold, italics, or underlining), and even the placement of the labels
however you feel is best for examining the map data.
5.9 Measurements on a Map
1. With all the cities now labeled, it’s easier to keep track of all of them.
With this in mind, your next task is to make a series of measurements
between points to see what the Euclidian (straight line) distance is
between cities in northeast Ohio.
2. Zoom in tightly so that your View contains the cities of Youngstown and
Warren and the other cities between them.
3. Select the Measure tool from the toolbar—it’s the one that resembles a
ruler with two blue arrows over it.
(Source: Esri® ArcGIS ArcMap ArcInfo graphical user interface Copyright © Esri.)