

127
GIS Introduction: AEJEE Version
Important note: At the bottom of the cities’ attribute table, you’ll see that
four records have been selected (the four cities near Youngstown). That’s all
well and good, but you’ll also see that there are 3557 records in the entire attribute table (and thus, there are 3557 point objects in the cities data layer).
To find those four records would mean a lot of digging through the data. However, AEJEE has some helpful sorting features, including one that will sort the
table and move the selected records to the top.
2. Scroll across the attribute table to find the field called ST (which has
the two-letter abbreviations for each state). It’s between the CLASS and
STFIPS fields and may require stretching its boundaries out. Rightclick on the name of the ST field and from the new list of options,
choose Sort Selected Data To The Top. The selected records will be
highlighted in cyan and moved to the top records in the table.
Question 5.6 Without using Identify, which four cities did you select?
Question 5.7 How many total women (the attribute table lists this statistic
as “Females”) live in these four cities combined?
3. Close the attribute table when you’re done.
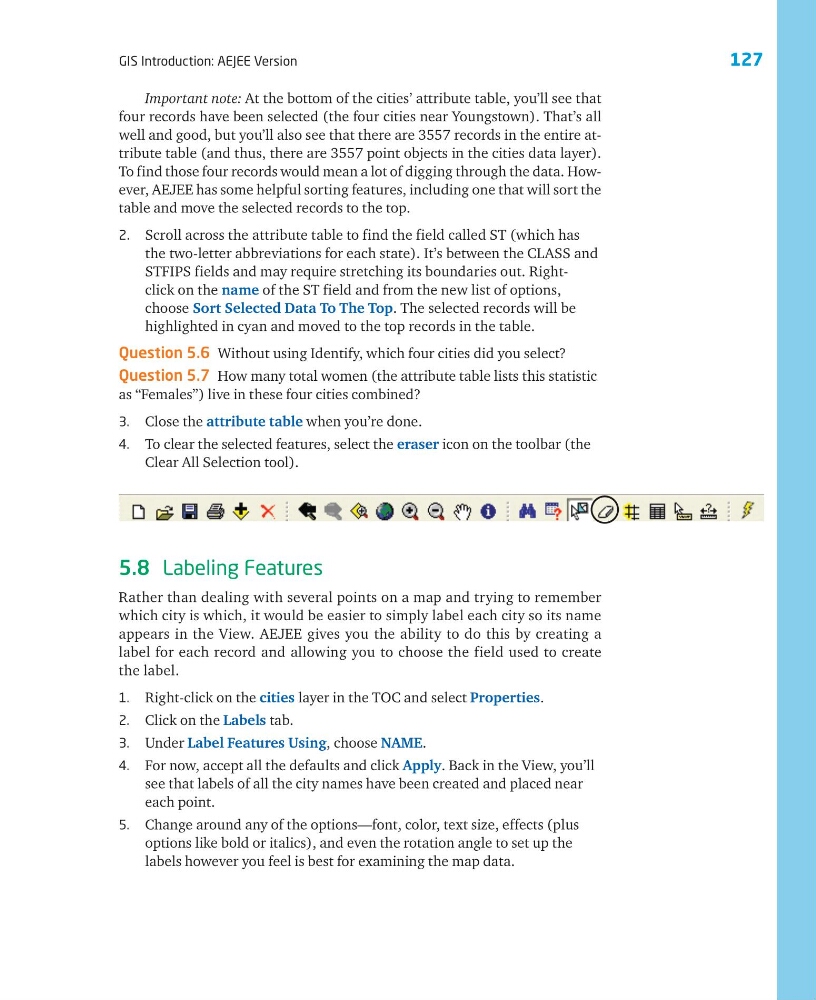
4. To clear the selected features, select the eraser icon on the toolbar (the
Clear All Selection tool).
5.8 Labeling Features
Rather than dealing with several points on a map and trying to remember
which city is which, it would be easier to simply label each city so its name
appears in the View. AEJEE gives you the ability to do this by creating a
label for each record and allowing you to choose the field used to create
the label.
1. Right-click on the cities layer in the TOC and select Properties.
2. Click on the Labels tab.
3. Under Label Features Using, choose NAME.
4. For now, accept all the defaults and click Apply. Back in the View, you’ll
see that labels of all the city names have been created and placed near
each point.
5. Change around any of the options—font, color, text size, effects (plus
options like bold or italics), and even the rotation angle to set up the
labels however you feel is best for examining the map data.
GIS Introduction: AEJEE Version
Important note: At the bottom of the cities’ attribute table, you’ll see that
four records have been selected (the four cities near Youngstown). That’s all
well and good, but you’ll also see that there are 3557 records in the entire attribute table (and thus, there are 3557 point objects in the cities data layer).
To find those four records would mean a lot of digging through the data. However, AEJEE has some helpful sorting features, including one that will sort the
table and move the selected records to the top.
2. Scroll across the attribute table to find the field called ST (which has
the two-letter abbreviations for each state). It’s between the CLASS and
STFIPS fields and may require stretching its boundaries out. Rightclick on the name of the ST field and from the new list of options,
choose Sort Selected Data To The Top. The selected records will be
highlighted in cyan and moved to the top records in the table.
Question 5.6 Without using Identify, which four cities did you select?
Question 5.7 How many total women (the attribute table lists this statistic
as “Females”) live in these four cities combined?
3. Close the attribute table when you’re done.
4. To clear the selected features, select the eraser icon on the toolbar (the
Clear All Selection tool).
5.8 Labeling Features
Rather than dealing with several points on a map and trying to remember
which city is which, it would be easier to simply label each city so its name
appears in the View. AEJEE gives you the ability to do this by creating a
label for each record and allowing you to choose the field used to create
the label.
1. Right-click on the cities layer in the TOC and select Properties.
2. Click on the Labels tab.
3. Under Label Features Using, choose NAME.
4. For now, accept all the defaults and click Apply. Back in the View, you’ll
see that labels of all the city names have been created and placed near
each point.
5. Change around any of the options—font, color, text size, effects (plus
options like bold or italics), and even the rotation angle to set up the
labels however you feel is best for examining the map data.