

122
Chapter 5 Working With Digital Spatial Data and GIS
3. You’ll now see the states.shp in the TOC, and its content is displayed in
the View.
4. In the TOC, you’ll see a checkmark in the box next to the states shapefile.
When the checkmark is displayed, the layer will be shown in the View,
and when the checkmark is removed (by clicking on it), the layer will
not be displayed.
5. Now add two more layers, cities (a point layer), and intrstat (a line
layer). All three of your layers will now be in the TOC.
6. You can manipulate the “drawing order” of items in the TOC by grabbing
a layer with the mouse and moving it up or down in the TOC. Whatever
layer is at the bottom is drawn first, and the layers above it in the TOC
are drawn on top of it. Thus, if you move the states layer to the top of
the TOC, the other layers will not be visible in the View since the states’
polygons are being drawn over the top of them.
5.3 Symbology of Features in AEJEE
1. You’ll also notice that the symbology generated for each of the three
objects is simple—points, lines, and polygons have been assigned a
random color. You can significantly alter the appearance of the objects
in the View to customize your maps.
2. Right-click on the states layer and select Properties.
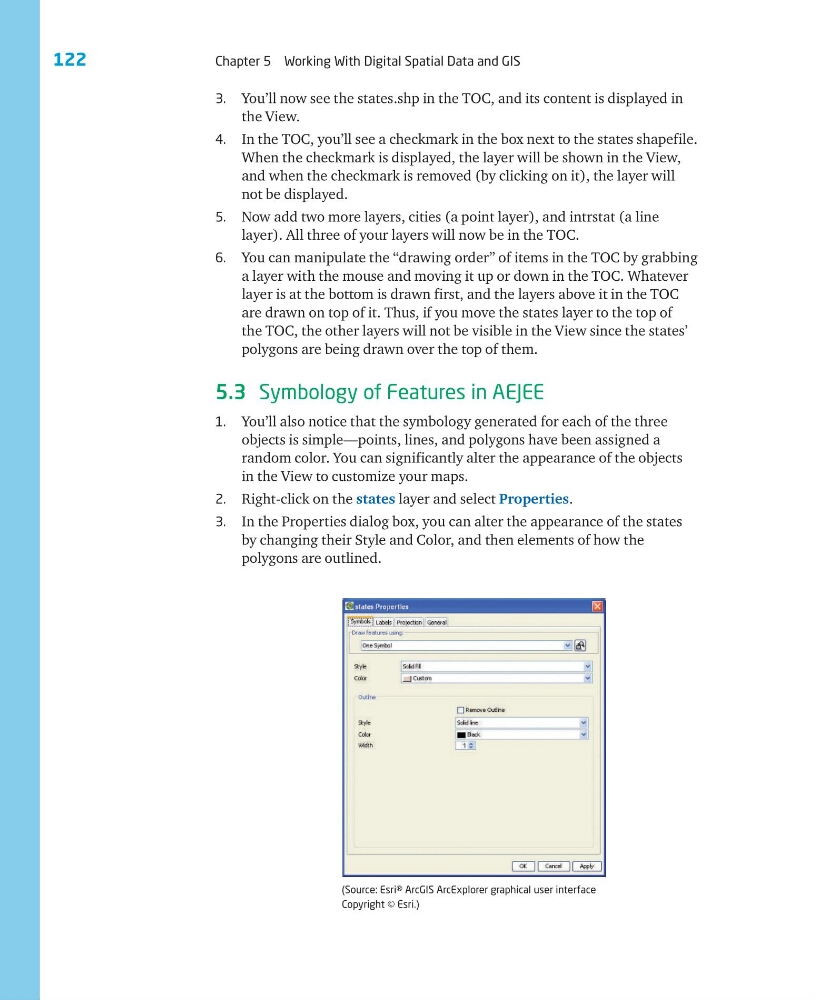
3. In the Properties dialog box, you can alter the appearance of the states
by changing their Style and Color, and then elements of how the
polygons are outlined.
(Source: Esri® ArcGIS ArcExplorer graphical user interface
Copyright © Esri.)
Chapter 5 Working With Digital Spatial Data and GIS
3. You’ll now see the states.shp in the TOC, and its content is displayed in
the View.
4. In the TOC, you’ll see a checkmark in the box next to the states shapefile.
When the checkmark is displayed, the layer will be shown in the View,
and when the checkmark is removed (by clicking on it), the layer will
not be displayed.
5. Now add two more layers, cities (a point layer), and intrstat (a line
layer). All three of your layers will now be in the TOC.
6. You can manipulate the “drawing order” of items in the TOC by grabbing
a layer with the mouse and moving it up or down in the TOC. Whatever
layer is at the bottom is drawn first, and the layers above it in the TOC
are drawn on top of it. Thus, if you move the states layer to the top of
the TOC, the other layers will not be visible in the View since the states’
polygons are being drawn over the top of them.
5.3 Symbology of Features in AEJEE
1. You’ll also notice that the symbology generated for each of the three
objects is simple—points, lines, and polygons have been assigned a
random color. You can significantly alter the appearance of the objects
in the View to customize your maps.
2. Right-click on the states layer and select Properties.
3. In the Properties dialog box, you can alter the appearance of the states
by changing their Style and Color, and then elements of how the
polygons are outlined.
(Source: Esri® ArcGIS ArcExplorer graphical user interface
Copyright © Esri.)