

104
Chapter 5 Working With Digital Spatial Data and GIS
as well, you’ll have several polygons stored in a single layer in the GIS. When
you examine the data, you’ll find you have five polygon entries in that data layer
(your house and four others). Similarly, you could sketch each house’s driveway
as a line object by tracing the mouse over the appropriate place in the image,
which would result in a second data layer that’s comprised of five lines. With
digitizing, each of your sketches can be translated into a vector object.
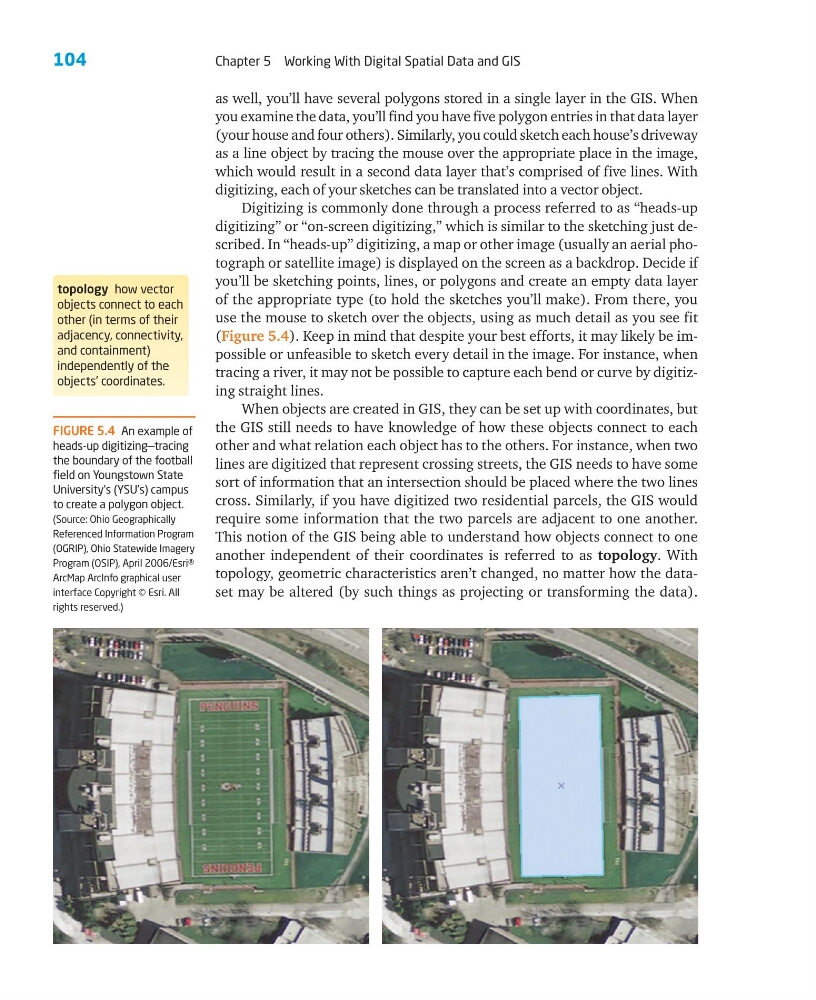
Digitizing is commonly done through a process referred to as “heads-up
digitizing” or “on-screen digitizing,” which is similar to the sketching just described. In “heads-up” digitizing, a map or other image (usually an aerial photograph or satellite image) is displayed on the screen as a backdrop. Decide if
you’ll be sketching points, lines, or polygons and create an empty data layer
of the appropriate type (to hold the sketches you’ll make). From there, you
use the mouse to sketch over the objects, using as much detail as you see fit
(Figure 5.4). Keep in mind that despite your best efforts, it may likely be impossible or unfeasible to sketch every detail in the image. For instance, when
tracing a river, it may not be possible to capture each bend or curve by digitizing straight lines.
When objects are created in GIS, they can be set up with coordinates, but
the GIS still needs to have knowledge of how these objects connect to each
other and what relation each object has to the others. For instance, when two
lines are digitized that represent crossing streets, the GIS needs to have some
sort of information that an intersection should be placed where the two lines
cross. Similarly, if you have digitized two residential parcels, the GIS would
require some information that the two parcels are adjacent to one another.
This notion of the GIS being able to understand how objects connect to one
another independent of their coordinates is referred to as topology. With
topology, geometric characteristics aren’t changed, no matter how the dataset may be altered (by such things as projecting or transforming the data).
FIGURE 5.4 An example of
heads-up digitizing—tracing
the boundary of the football
field on Youngstown State
University’s (YSU’s) campus
to create a polygon object.
(Source: Ohio Geographically
Referenced Information Program
(OGRIP), Ohio Statewide Imagery
Program (OSIP), April 2006/Esri®
ArcMap ArcInfo graphical user
interface Copyright © Esri. All
rights reserved.)
topology how vector
objects connect to each
other (in terms of their
adjacency, connectivity,
and containment)
independently of the
objects’ coordinates.
Chapter 5 Working With Digital Spatial Data and GIS
as well, you’ll have several polygons stored in a single layer in the GIS. When
you examine the data, you’ll find you have five polygon entries in that data layer
(your house and four others). Similarly, you could sketch each house’s driveway
as a line object by tracing the mouse over the appropriate place in the image,
which would result in a second data layer that’s comprised of five lines. With
digitizing, each of your sketches can be translated into a vector object.
Digitizing is commonly done through a process referred to as “heads-up
digitizing” or “on-screen digitizing,” which is similar to the sketching just described. In “heads-up” digitizing, a map or other image (usually an aerial photograph or satellite image) is displayed on the screen as a backdrop. Decide if
you’ll be sketching points, lines, or polygons and create an empty data layer
of the appropriate type (to hold the sketches you’ll make). From there, you
use the mouse to sketch over the objects, using as much detail as you see fit
(Figure 5.4). Keep in mind that despite your best efforts, it may likely be impossible or unfeasible to sketch every detail in the image. For instance, when
tracing a river, it may not be possible to capture each bend or curve by digitizing straight lines.
When objects are created in GIS, they can be set up with coordinates, but
the GIS still needs to have knowledge of how these objects connect to each
other and what relation each object has to the others. For instance, when two
lines are digitized that represent crossing streets, the GIS needs to have some
sort of information that an intersection should be placed where the two lines
cross. Similarly, if you have digitized two residential parcels, the GIS would
require some information that the two parcels are adjacent to one another.
This notion of the GIS being able to understand how objects connect to one
another independent of their coordinates is referred to as topology. With
topology, geometric characteristics aren’t changed, no matter how the dataset may be altered (by such things as projecting or transforming the data).
FIGURE 5.4 An example of
heads-up digitizing—tracing
the boundary of the football
field on Youngstown State
University’s (YSU’s) campus
to create a polygon object.
(Source: Ohio Geographically
Referenced Information Program
(OGRIP), Ohio Statewide Imagery
Program (OSIP), April 2006/Esri®
ArcMap ArcInfo graphical user
interface Copyright © Esri. All
rights reserved.)
topology how vector
objects connect to each
other (in terms of their
adjacency, connectivity,
and containment)
independently of the
objects’ coordinates.