

105
How Does GIS Represent Real-World Items?
Topology establishes adjacency (that is, how one polygon relates to another
polygon, in that they share a common boundary), connectivity (that is, how
lines can intersect with one another), and containment (that is, how locations
are situated inside of a polygon boundary).
Digital Line Graphs (DLGs) are examples of vector data applications in
GIS. DLGs were created from United States Geologic Survey (USGS) topographic maps (see Chapter 13 for more information about topographic
maps), featuring vector datasets representing transportation features (such
as streets, highways, and railroads), hydrography features (such as rivers or
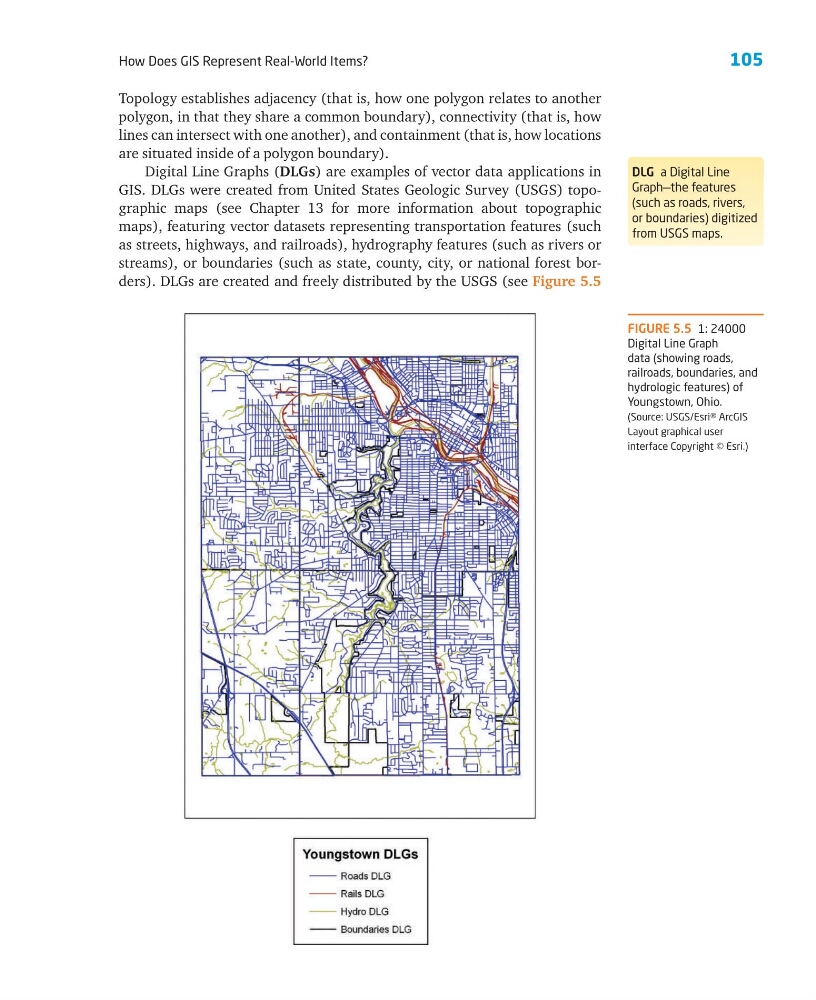
streams), or boundaries (such as state, county, city, or national forest borders). DLGs are created and freely distributed by the USGS (see Figure 5.5
DLG a Digital Line
Graph—the features
(such as roads, rivers,
or boundaries) digitized
from USGS maps.
FIGURE 5.5 1: 24000
Digital Line Graph
data (showing roads,
railroads, boundaries, and
hydrologic features) of
Youngstown, Ohio.
(Source: USGS/Esri® ArcGIS
Layout graphical user
interface Copyright © Esri.)
How Does GIS Represent Real-World Items?
Topology establishes adjacency (that is, how one polygon relates to another
polygon, in that they share a common boundary), connectivity (that is, how
lines can intersect with one another), and containment (that is, how locations
are situated inside of a polygon boundary).
Digital Line Graphs (DLGs) are examples of vector data applications in
GIS. DLGs were created from United States Geologic Survey (USGS) topographic maps (see Chapter 13 for more information about topographic
maps), featuring vector datasets representing transportation features (such
as streets, highways, and railroads), hydrography features (such as rivers or
streams), or boundaries (such as state, county, city, or national forest borders). DLGs are created and freely distributed by the USGS (see Figure 5.5
DLG a Digital Line
Graph—the features
(such as roads, rivers,
or boundaries) digitized
from USGS maps.
FIGURE 5.5 1: 24000
Digital Line Graph
data (showing roads,
railroads, boundaries, and
hydrologic features) of
Youngstown, Ohio.
(Source: USGS/Esri® ArcGIS
Layout graphical user
interface Copyright © Esri.)