

103
How Does GIS Represent Real-World Items?
These three items are referred to as vector objects, as they make up
the basis of the GIS vector data model. Basically, the vector data model is a
means of representing and handling real-world spatial information as a series
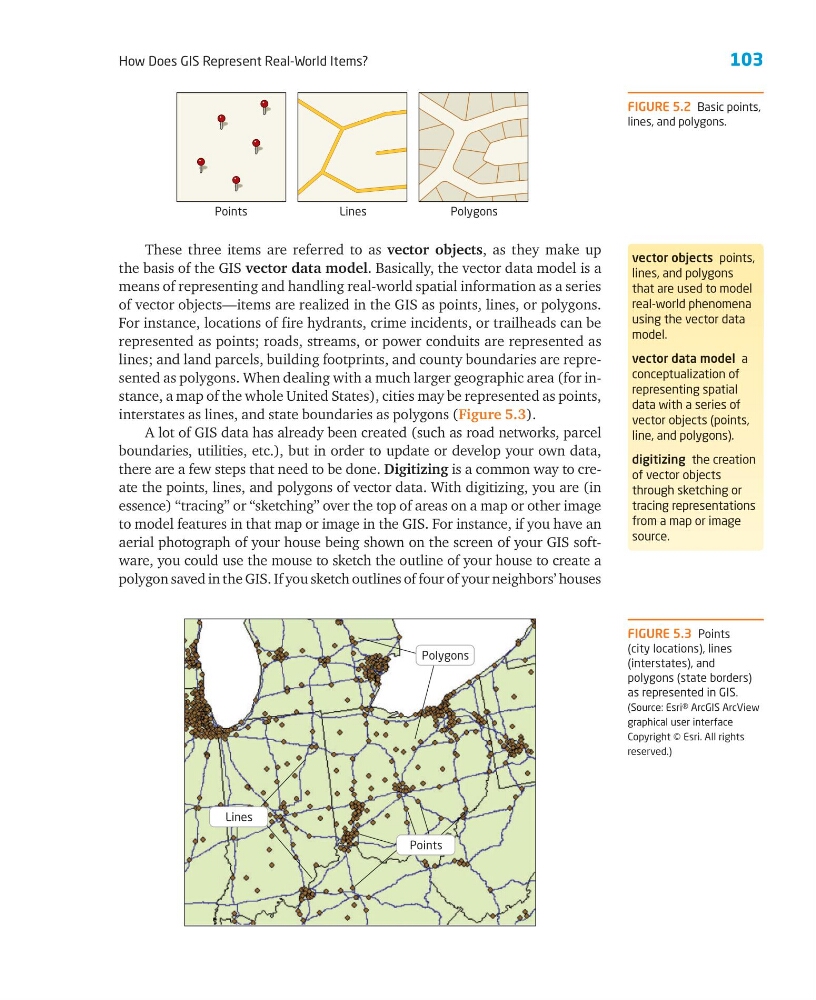
of vector objects—items are realized in the GIS as points, lines, or polygons.
For instance, locations of fire hydrants, crime incidents, or trailheads can be
represented as points; roads, streams, or power conduits are represented as
lines; and land parcels, building footprints, and county boundaries are represented as polygons. When dealing with a much larger geographic area (for instance, a map of the whole United States), cities may be represented as points,
interstates as lines, and state boundaries as polygons (Figure 5.3).
A lot of GIS data has already been created (such as road networks, parcel
boundaries, utilities, etc.), but in order to update or develop your own data,
there are a few steps that need to be done. Digitizing is a common way to create the points, lines, and polygons of vector data. With digitizing, you are (in
essence) “tracing” or “sketching” over the top of areas on a map or other image
to model features in that map or image in the GIS. For instance, if you have an
aerial photograph of your house being shown on the screen of your GIS software, you could use the mouse to sketch the outline of your house to create a
polygon saved in the GIS. If you sketch outlines of four of your neighbors’ houses
FIGURE 5.2 Basic points,
lines, and polygons.
Points
Lines
Polygons
vector objects points,
lines, and polygons
that are used to model
real-world phenomena
using the vector data
model.
vector data model a
conceptualization of
representing spatial
data with a series of
vector objects (points,
line, and polygons).
digitizing the creation
of vector objects
through sketching or
tracing representations
from a map or image
source.
FIGURE 5.3 Points
(city locations), lines
(interstates), and
polygons (state borders)
as represented in GIS.
(Source: Esri® ArcGIS ArcView
graphical user interface
Copyright © Esri. All rights
reserved.)
Polygons
Points
Lines
How Does GIS Represent Real-World Items?
These three items are referred to as vector objects, as they make up
the basis of the GIS vector data model. Basically, the vector data model is a
means of representing and handling real-world spatial information as a series
of vector objects—items are realized in the GIS as points, lines, or polygons.
For instance, locations of fire hydrants, crime incidents, or trailheads can be
represented as points; roads, streams, or power conduits are represented as
lines; and land parcels, building footprints, and county boundaries are represented as polygons. When dealing with a much larger geographic area (for instance, a map of the whole United States), cities may be represented as points,
interstates as lines, and state boundaries as polygons (Figure 5.3).
A lot of GIS data has already been created (such as road networks, parcel
boundaries, utilities, etc.), but in order to update or develop your own data,
there are a few steps that need to be done. Digitizing is a common way to create the points, lines, and polygons of vector data. With digitizing, you are (in
essence) “tracing” or “sketching” over the top of areas on a map or other image
to model features in that map or image in the GIS. For instance, if you have an
aerial photograph of your house being shown on the screen of your GIS software, you could use the mouse to sketch the outline of your house to create a
polygon saved in the GIS. If you sketch outlines of four of your neighbors’ houses
FIGURE 5.2 Basic points,
lines, and polygons.
Points
Lines
Polygons
vector objects points,
lines, and polygons
that are used to model
real-world phenomena
using the vector data
model.
vector data model a
conceptualization of
representing spatial
data with a series of
vector objects (points,
line, and polygons).
digitizing the creation
of vector objects
through sketching or
tracing representations
from a map or image
source.
FIGURE 5.3 Points
(city locations), lines
(interstates), and
polygons (state borders)
as represented in GIS.
(Source: Esri® ArcGIS ArcView
graphical user interface
Copyright © Esri. All rights
reserved.)
Polygons
Points
Lines