

95
GPS Applications
4. The number of satellites visibility graph will appear, showing the
number of visible satellites on the y-axis and a 24-hour time frame on
the x-axis.
Question 4.1 At what times of day are the maximum number of GPS
satellites visible? What is this maximum number?
Question 4.2 At what times of day are the minimum number of GPS
satellites visible? What is this minimum number?
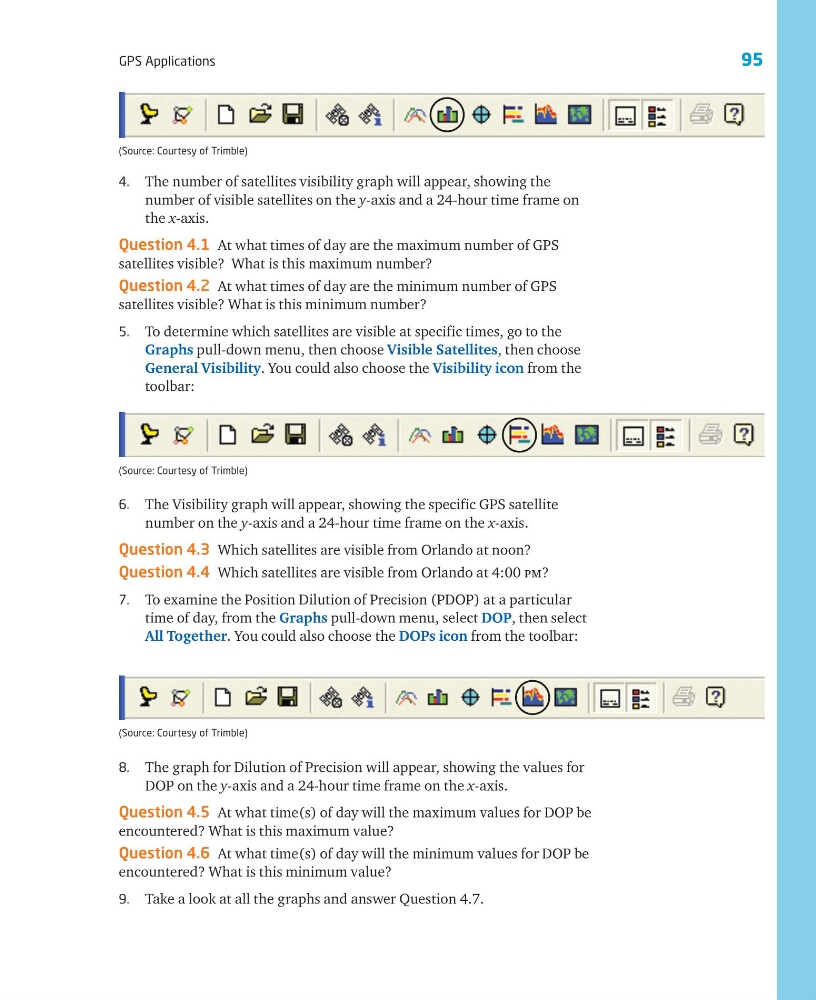
5. To determine which satellites are visible at specific times, go to the
Graphs pull-down menu, then choose Visible Satellites, then choose
General Visibility. You could also choose the Visibility icon from the
toolbar:
6. The Visibility graph will appear, showing the specific GPS satellite
number on the y-axis and a 24-hour time frame on the x-axis.
Question 4.3 Which satellites are visible from Orlando at noon?
Question 4.4 Which satellites are visible from Orlando at 4:00 pm?
7. To examine the Position Dilution of Precision (PDOP) at a particular
time of day, from the Graphs pull-down menu, select DOP, then select
All Together. You could also choose the DOPs icon from the toolbar:
8. The graph for Dilution of Precision will appear, showing the values for
DOP on the y-axis and a 24-hour time frame on the x-axis.
Question 4.5 At what time(s) of day will the maximum values for DOP be
encountered? What is this maximum value?
Question 4.6 At what time(s) of day will the minimum values for DOP be
encountered? What is this minimum value?
9. Take a look at all the graphs and answer Question 4.7.
(Source: Courtesy of Trimble)
(Source: Courtesy of Trimble)
(Source: Courtesy of Trimble)
GPS Applications
4. The number of satellites visibility graph will appear, showing the
number of visible satellites on the y-axis and a 24-hour time frame on
the x-axis.
Question 4.1 At what times of day are the maximum number of GPS
satellites visible? What is this maximum number?
Question 4.2 At what times of day are the minimum number of GPS
satellites visible? What is this minimum number?
5. To determine which satellites are visible at specific times, go to the
Graphs pull-down menu, then choose Visible Satellites, then choose
General Visibility. You could also choose the Visibility icon from the
toolbar:
6. The Visibility graph will appear, showing the specific GPS satellite
number on the y-axis and a 24-hour time frame on the x-axis.
Question 4.3 Which satellites are visible from Orlando at noon?
Question 4.4 Which satellites are visible from Orlando at 4:00 pm?
7. To examine the Position Dilution of Precision (PDOP) at a particular
time of day, from the Graphs pull-down menu, select DOP, then select
All Together. You could also choose the DOPs icon from the toolbar:
8. The graph for Dilution of Precision will appear, showing the values for
DOP on the y-axis and a 24-hour time frame on the x-axis.
Question 4.5 At what time(s) of day will the maximum values for DOP be
encountered? What is this maximum value?
Question 4.6 At what time(s) of day will the minimum values for DOP be
encountered? What is this minimum value?
9. Take a look at all the graphs and answer Question 4.7.
(Source: Courtesy of Trimble)
(Source: Courtesy of Trimble)
(Source: Courtesy of Trimble)