

Session 3 : Hydrological analysis of two sub-catchments of the Mareb River (Eritrea)
256
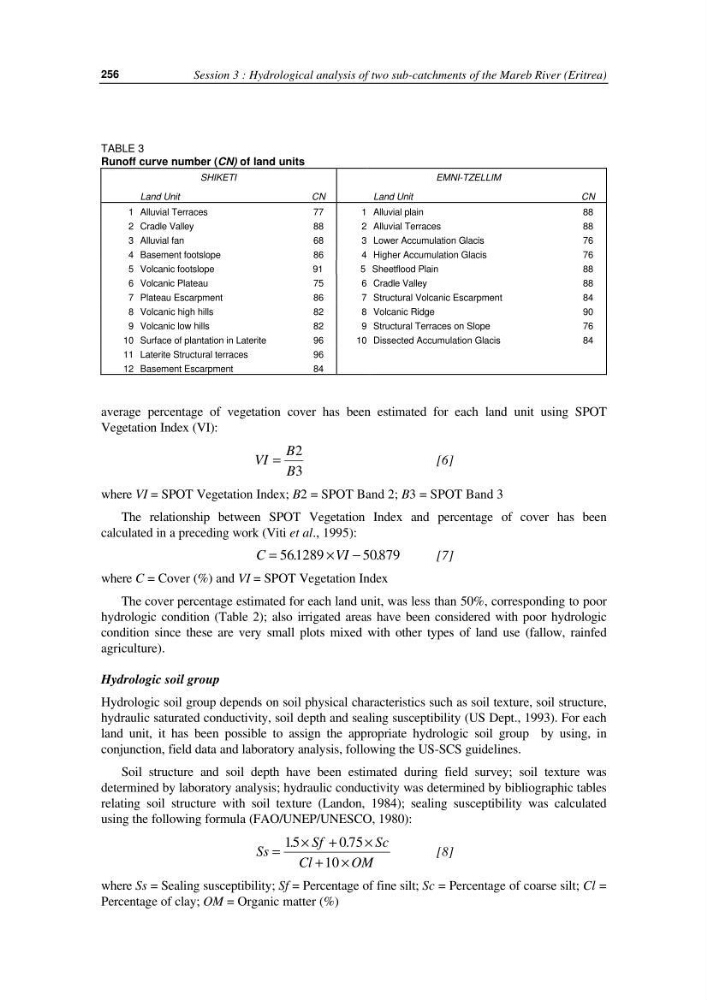
TABLE 3
Runoff curve number (CN) of land units
SHIKETI
EMNI-TZELLIM
Land Unit
CN
Land Unit
CN
1 Alluvial Terraces
77
1 Alluvial plain
88
2 Cradle Valley
88
2 Alluvial Terraces
88
3 Alluvial fan
68
3 Lower Accumulation Glacis
76
4 Basement footslope
86
4 Higher Accumulation Glacis
76
5 Volcanic footslope
91
5 Sheetflood Plain
88
6 Volcanic Plateau
75
6 Cradle Valley
88
7 Plateau Escarpment
86
7 Structural Volcanic Escarpment
84
8 Volcanic high hills
82
8 Volcanic Ridge
90
9 Volcanic low hills
82
9 Structural Terraces on Slope
76
10 Surface of plantation in Laterite
96
10 Dissected Accumulation Glacis
84
11 Laterite Structural terraces
96
12 Basement Escarpment
84
average percentage of vegetation cover has been estimated for each land unit using SPOT
Vegetation Index (VI):
VI
B
B
=
2
3
[6]
where VI = SPOT Vegetation Index; B2 = SPOT Band 2; B3 = SPOT Band 3
The relationship between SPOT Vegetation Index and percentage of cover has been
calculated in a preceding work (Viti et al., 1995):
C
VI
=
× −
561289
50 879
.
.
[7]
where C = Cover (%) and VI = SPOT Vegetation Index
The cover percentage estimated for each land unit, was less than 50%, corresponding to poor
hydrologic condition (Table 2); also irrigated areas have been considered with poor hydrologic
condition since these are very small plots mixed with other types of land use (fallow, rainfed
agriculture).
Hydrologic soil group
Hydrologic soil group depends on soil physical characteristics such as soil texture, soil structure,
hydraulic saturated conductivity, soil depth and sealing susceptibility (US Dept., 1993). For each
land unit, it has been possible to assign the appropriate hydrologic soil group by using, in
conjunction, field data and laboratory analysis, following the US-SCS guidelines.
Soil structure and soil depth have been estimated during field survey; soil texture was
determined by laboratory analysis; hydraulic conductivity was determined by bibliographic tables
relating soil structure with soil texture (Landon, 1984); sealing susceptibility was calculated
using the following formula (FAO/UNEP/UNESCO, 1980):
Ss
Sf
Sc
Cl
OM
=
× +
×
+ ×
15
0 75
10
.
.
[8]
where Ss = Sealing susceptibility; Sf = Percentage of fine silt; Sc = Percentage of coarse silt; Cl =
Percentage of clay; OM = Organic matter (%)
256
TABLE 3
Runoff curve number (CN) of land units
SHIKETI
EMNI-TZELLIM
Land Unit
CN
Land Unit
CN
1 Alluvial Terraces
77
1 Alluvial plain
88
2 Cradle Valley
88
2 Alluvial Terraces
88
3 Alluvial fan
68
3 Lower Accumulation Glacis
76
4 Basement footslope
86
4 Higher Accumulation Glacis
76
5 Volcanic footslope
91
5 Sheetflood Plain
88
6 Volcanic Plateau
75
6 Cradle Valley
88
7 Plateau Escarpment
86
7 Structural Volcanic Escarpment
84
8 Volcanic high hills
82
8 Volcanic Ridge
90
9 Volcanic low hills
82
9 Structural Terraces on Slope
76
10 Surface of plantation in Laterite
96
10 Dissected Accumulation Glacis
84
11 Laterite Structural terraces
96
12 Basement Escarpment
84
average percentage of vegetation cover has been estimated for each land unit using SPOT
Vegetation Index (VI):
VI
B
B
=
2
3
[6]
where VI = SPOT Vegetation Index; B2 = SPOT Band 2; B3 = SPOT Band 3
The relationship between SPOT Vegetation Index and percentage of cover has been
calculated in a preceding work (Viti et al., 1995):
C
VI
=
× −
561289
50 879
.
.
[7]
where C = Cover (%) and VI = SPOT Vegetation Index
The cover percentage estimated for each land unit, was less than 50%, corresponding to poor
hydrologic condition (Table 2); also irrigated areas have been considered with poor hydrologic
condition since these are very small plots mixed with other types of land use (fallow, rainfed
agriculture).
Hydrologic soil group
Hydrologic soil group depends on soil physical characteristics such as soil texture, soil structure,
hydraulic saturated conductivity, soil depth and sealing susceptibility (US Dept., 1993). For each
land unit, it has been possible to assign the appropriate hydrologic soil group by using, in
conjunction, field data and laboratory analysis, following the US-SCS guidelines.
Soil structure and soil depth have been estimated during field survey; soil texture was
determined by laboratory analysis; hydraulic conductivity was determined by bibliographic tables
relating soil structure with soil texture (Landon, 1984); sealing susceptibility was calculated
using the following formula (FAO/UNEP/UNESCO, 1980):
Ss
Sf
Sc
Cl
OM
=
× +
×
+ ×
15
0 75
10
.
.
[8]
where Ss = Sealing susceptibility; Sf = Percentage of fine silt; Sc = Percentage of coarse silt; Cl =
Percentage of clay; OM = Organic matter (%)