

Télédétection et ressources en eau/Remote sensing and water resources
257
By using Table 2 it has been possible to evaluate the CN for the assigned hydrological soil
group.
Impervious area
Rockiness has been considered as connected impervious area. Percentage of rock outcrops has
been estimated in the field for each land unit. For some land units, such as laterite terraces and
volcanic hills, CN values have been corrected in relation of the percentage of impervious area
using adjustments graphics (US Dept., 1986).
Finally, Curve Numbers of each land unit have been estimated (Table 3).
DAILY RUNOFF
The following factors have been considered in order to predict the volume of runoff for the
maximum 24-hours rainfall with 25-years return period: daily rainfall, Curve Number and
Antecedent Moisture Condition.
Mean duration of a storm is four hours and maximum duration is about seven hours
(Griffiths, 1972); July and August daily rainfall distribution is mostly concentrated in a range
between 5 to 10 mm. Rainfall intensity has been estimated by the formula of Fletcher (1950):
rainfall intensity for 1 hour interval is 27 mm/h. The following formula (Gumbel, 1954) has been
used to estimate the return period of the maximum 24-hours precipitation:
T
N
m
=
+ 1
[9]
where T = return period in years; N = total number of statistical events; m = rank of events
arranged in descending order of magnitude.
Using daily rainfall data of 28 years (Fantoli, 1966), the annual maximum precipitation with
a 25-years return period is 102 mm, and it has been used as P in [3].
The Runoff Curve Number has been calculated for each land unit, assuming the type II of
Antecedent soil Moisture Condition (AMC II). The CN adjustments table has been used in order
to adjust the CN for wet (AMC III) and dry (AMC I) soils (Wanielista M. P.,1990).
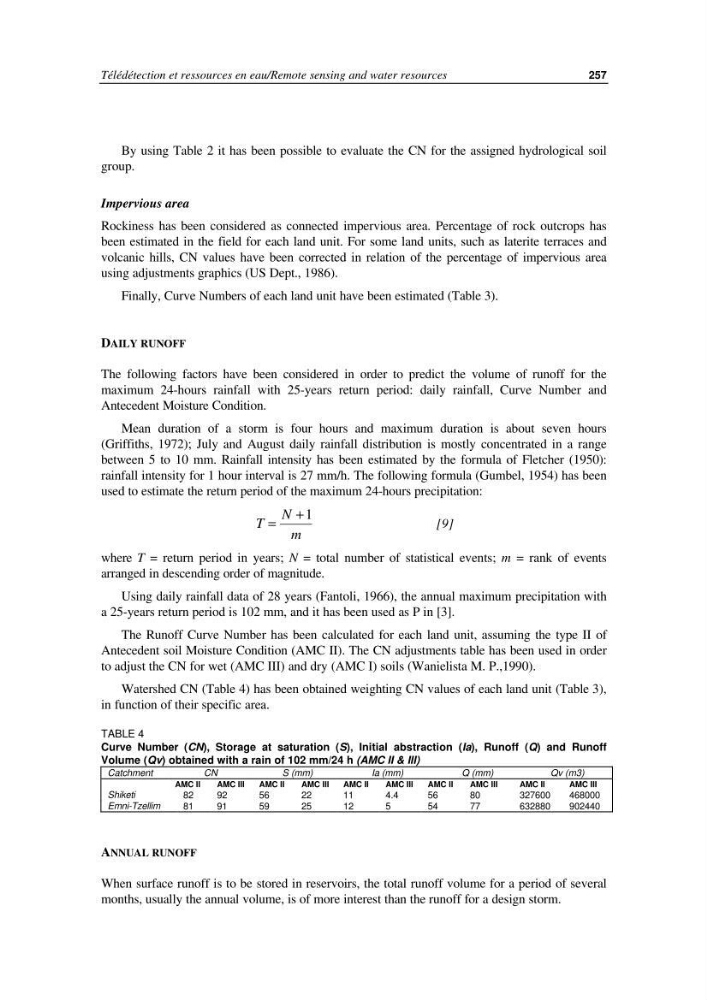
Watershed CN (Table 4) has been obtained weighting CN values of each land unit (Table 3),
in function of their specific area.
TABLE 4
Curve Number (CN), Storage at saturation (S), Initial abstraction (Ia), Runoff (Q) and Runoff
Volume (Qv) obtained with a rain of 102 mm/24 h (AMC II & III)
Catchment
CN
S (mm)
Ia (mm)
Q (mm)
Qv (m3)
AMC II
AMC III
AMC II
AMC III
AMC II
AMC III
AMC II
AMC III
AMC II
AMC III
Shiketi
82
92
56
22
11
4.4
56
80
327600
468000
Emni-Tzellim
81
91
59
25
12
5
54
77
632880
902440
ANNUAL RUNOFF
When surface runoff is to be stored in reservoirs, the total runoff volume for a period of several
months, usually the annual volume, is of more interest than the runoff for a design storm.
257
By using Table 2 it has been possible to evaluate the CN for the assigned hydrological soil
group.
Impervious area
Rockiness has been considered as connected impervious area. Percentage of rock outcrops has
been estimated in the field for each land unit. For some land units, such as laterite terraces and
volcanic hills, CN values have been corrected in relation of the percentage of impervious area
using adjustments graphics (US Dept., 1986).
Finally, Curve Numbers of each land unit have been estimated (Table 3).
DAILY RUNOFF
The following factors have been considered in order to predict the volume of runoff for the
maximum 24-hours rainfall with 25-years return period: daily rainfall, Curve Number and
Antecedent Moisture Condition.
Mean duration of a storm is four hours and maximum duration is about seven hours
(Griffiths, 1972); July and August daily rainfall distribution is mostly concentrated in a range
between 5 to 10 mm. Rainfall intensity has been estimated by the formula of Fletcher (1950):
rainfall intensity for 1 hour interval is 27 mm/h. The following formula (Gumbel, 1954) has been
used to estimate the return period of the maximum 24-hours precipitation:
T
N
m
=
+ 1
[9]
where T = return period in years; N = total number of statistical events; m = rank of events
arranged in descending order of magnitude.
Using daily rainfall data of 28 years (Fantoli, 1966), the annual maximum precipitation with
a 25-years return period is 102 mm, and it has been used as P in [3].
The Runoff Curve Number has been calculated for each land unit, assuming the type II of
Antecedent soil Moisture Condition (AMC II). The CN adjustments table has been used in order
to adjust the CN for wet (AMC III) and dry (AMC I) soils (Wanielista M. P.,1990).
Watershed CN (Table 4) has been obtained weighting CN values of each land unit (Table 3),
in function of their specific area.
TABLE 4
Curve Number (CN), Storage at saturation (S), Initial abstraction (Ia), Runoff (Q) and Runoff
Volume (Qv) obtained with a rain of 102 mm/24 h (AMC II & III)
Catchment
CN
S (mm)
Ia (mm)
Q (mm)
Qv (m3)
AMC II
AMC III
AMC II
AMC III
AMC II
AMC III
AMC II
AMC III
AMC II
AMC III
Shiketi
82
92
56
22
11
4.4
56
80
327600
468000
Emni-Tzellim
81
91
59
25
12
5
54
77
632880
902440
ANNUAL RUNOFF
When surface runoff is to be stored in reservoirs, the total runoff volume for a period of several
months, usually the annual volume, is of more interest than the runoff for a design storm.