

Télédétection et ressources en eau/Remote sensing and water resources
255
The parameter S is related to soil and cover conditions of the watershed through the Curve
Number:
S
CN
=
−
25400 254
[4]
where CN = Curve Number
Runoff volume of the catchment has been calculated using the following formula:
Qv
Q A
= × ×
10
[5]
where Qv = runoff volume (m
3
); Q = runoff depth (mm); A = catchment area (ha)
The SCS-CN method has been applied to estimate daily and yearly surface runoff volume.
Remote sensing data (aerial photographs and satellite data) have been used, in conjunction
with other types of data (field data, laboratory analysis, bibliography) to estimate the Curve
Numbers.
Determination of Runoff Curve Number
The Shiketi and the Emni Tzellim sub-catchments have been classified into homogeneous portions
of land (land units) by satellite image processing and analysis and aerial photographs
interpretation (Table 3).
To select the appropriate CN the following factors have been considered: cover type,
hydrologic condition, hydrologic soil group, impervious area.
Cover type and hydrologic condition
As in other applications of the SCS-CN in developing countries (Purwanto and Donker, 1991),
also in this case it was difficult to determine the correspondence between land cover types and
CN, since the original method is based on land cover types common in North America. Adapting
the original tables to local conditions four main categories of land cover have been taken into
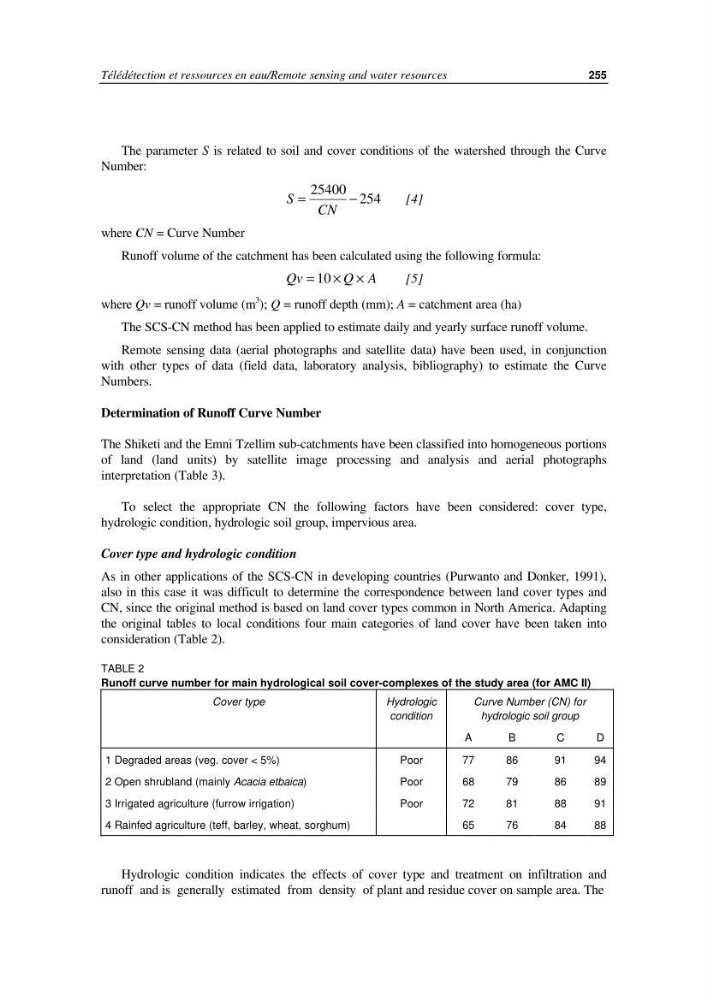
consideration (Table 2).
TABLE 2
Runoff curve number for main hydrological soil cover-complexes of the study area (for AMC II)
Cover type
Hydrologic
condition
Curve Number (CN) for
hydrologic soil group
A
B
C
D
1 Degraded areas (veg. cover < 5%)
Poor
77
86
91
94
2 Open shrubland (mainly Acacia etbaica)
Poor
68
79
86
89
3 Irrigated agriculture (furrow irrigation)
Poor
72
81
88
91
4 Rainfed agriculture (teff, barley, wheat, sorghum)
65
76
84
88
Hydrologic condition indicates the effects of cover type and treatment on infiltration and
runoff and is generally estimated from density of plant and residue cover on sample area. The
255
The parameter S is related to soil and cover conditions of the watershed through the Curve
Number:
S
CN
=
−
25400 254
[4]
where CN = Curve Number
Runoff volume of the catchment has been calculated using the following formula:
Qv
Q A
= × ×
10
[5]
where Qv = runoff volume (m
3
); Q = runoff depth (mm); A = catchment area (ha)
The SCS-CN method has been applied to estimate daily and yearly surface runoff volume.
Remote sensing data (aerial photographs and satellite data) have been used, in conjunction
with other types of data (field data, laboratory analysis, bibliography) to estimate the Curve
Numbers.
Determination of Runoff Curve Number
The Shiketi and the Emni Tzellim sub-catchments have been classified into homogeneous portions
of land (land units) by satellite image processing and analysis and aerial photographs
interpretation (Table 3).
To select the appropriate CN the following factors have been considered: cover type,
hydrologic condition, hydrologic soil group, impervious area.
Cover type and hydrologic condition
As in other applications of the SCS-CN in developing countries (Purwanto and Donker, 1991),
also in this case it was difficult to determine the correspondence between land cover types and
CN, since the original method is based on land cover types common in North America. Adapting
the original tables to local conditions four main categories of land cover have been taken into
consideration (Table 2).
TABLE 2
Runoff curve number for main hydrological soil cover-complexes of the study area (for AMC II)
Cover type
Hydrologic
condition
Curve Number (CN) for
hydrologic soil group
A
B
C
D
1 Degraded areas (veg. cover < 5%)
Poor
77
86
91
94
2 Open shrubland (mainly Acacia etbaica)
Poor
68
79
86
89
3 Irrigated agriculture (furrow irrigation)
Poor
72
81
88
91
4 Rainfed agriculture (teff, barley, wheat, sorghum)
65
76
84
88
Hydrologic condition indicates the effects of cover type and treatment on infiltration and
runoff and is generally estimated from density of plant and residue cover on sample area. The