

mature ecosystem would reradiate its energy at the lowest quality level and thus
would have the lowest surface temperature.
3.8.1 Beta Index as Measure of Surface Temperature Spatial Variation
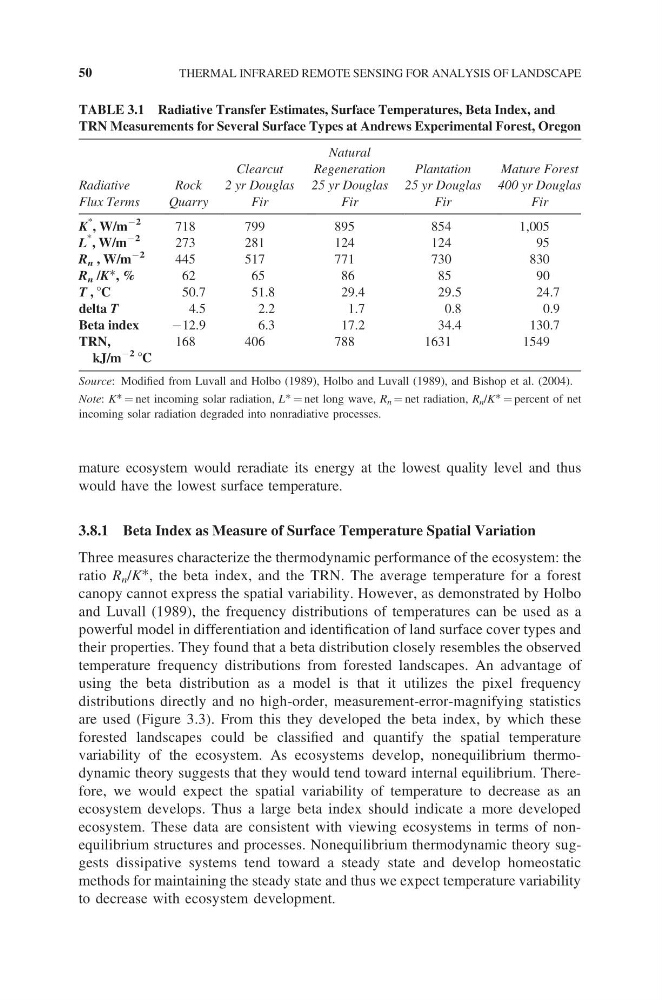
Three measures characterize the thermodynamic performance of the ecosystem: the
ratio R n /K*, the beta index, and the TRN. The average temperature for a forest
canopy cannot express the spatial variability. However, as demonstrated by Holbo
and Luvall (1989), the frequency distributions of temperatures can be used as a
powerful model in differentiation and identification of land surface cover types and
their properties. They found that a beta distribution closely resembles the observed
temperature frequency distributions from forested landscapes. An advantage of
using the beta distribution as a model is that it utilizes the pixel frequency
distributions directly and no high-order, measurement-error-magnifying statistics
are used (Figure 3.3). From this they developed the beta index, by which these
forested landscapes could be classified and quantify the spatial temperature
variability of the ecosystem. As ecosystems develop, nonequilibrium thermodynamic theory suggests that they would tend toward internal equilibrium. Therefore, we would expect the spatial variability of temperature to decrease as an
ecosystem develops. Thus a large beta index should indicate a more developed
ecosystem. These data are consistent with viewing ecosystems in terms of nonequilibrium structures and processes. Nonequilibrium thermodynamic theory suggests dissipative systems tend toward a steady state and develop homeostatic
methods for maintaining the steady state and thus we expect temperature variability
to decrease with ecosystem development.
TABLE 3.1 Radiative Transfer Estimates, Surface Temperatures, Beta Index, and
TRN Measurements for Several Surface Types at Andrews Experimental Forest, Oregon
Radiative
Flux Terms
Rock
Quarry
Clearcut
2 yr Douglas
Fir
Natural
Regeneration
25 yr Douglas
Fir
Plantation
25 yr Douglas
Fir
Mature Forest
400 yr Douglas
Fir
K
*
, W/m
−2
718
799
895
854
1,005
L
* , W/m
−2
273
281
124
124
95
R n , W/m
−2
445
517
771
730
830
R n /K*, %
62
65
86
85
90
T , °C
50.7
51.8
29.4
29.5
24.7
delta T
4.5
2.2
1.7
0.8
0.9
Beta index
−12.9
6.3
17.2
34.4
130.7
TRN,
kJ/m
−2
°C
168
406
788
1631
1549
Source: Modified from Luvall and Holbo (1989), Holbo and Luvall (1989), and Bishop et al. (2004).
Note: K* = net incoming solar radiation, L* = net long wave, R n = net radiation, R n /K* = percent of net
incoming solar radiation degraded into nonradiative processes.
50
THERMAL INFRARED REMOTE SENSING FOR ANALYSIS OF LANDSCAPE
would have the lowest surface temperature.
3.8.1 Beta Index as Measure of Surface Temperature Spatial Variation
Three measures characterize the thermodynamic performance of the ecosystem: the
ratio R n /K*, the beta index, and the TRN. The average temperature for a forest
canopy cannot express the spatial variability. However, as demonstrated by Holbo
and Luvall (1989), the frequency distributions of temperatures can be used as a
powerful model in differentiation and identification of land surface cover types and
their properties. They found that a beta distribution closely resembles the observed
temperature frequency distributions from forested landscapes. An advantage of
using the beta distribution as a model is that it utilizes the pixel frequency
distributions directly and no high-order, measurement-error-magnifying statistics
are used (Figure 3.3). From this they developed the beta index, by which these
forested landscapes could be classified and quantify the spatial temperature
variability of the ecosystem. As ecosystems develop, nonequilibrium thermodynamic theory suggests that they would tend toward internal equilibrium. Therefore, we would expect the spatial variability of temperature to decrease as an
ecosystem develops. Thus a large beta index should indicate a more developed
ecosystem. These data are consistent with viewing ecosystems in terms of nonequilibrium structures and processes. Nonequilibrium thermodynamic theory suggests dissipative systems tend toward a steady state and develop homeostatic
methods for maintaining the steady state and thus we expect temperature variability
to decrease with ecosystem development.
TABLE 3.1 Radiative Transfer Estimates, Surface Temperatures, Beta Index, and
TRN Measurements for Several Surface Types at Andrews Experimental Forest, Oregon
Radiative
Flux Terms
Rock
Quarry
Clearcut
2 yr Douglas
Fir
Natural
Regeneration
25 yr Douglas
Fir
Plantation
25 yr Douglas
Fir
Mature Forest
400 yr Douglas
Fir
K
*
, W/m
−2
718
799
895
854
1,005
L
* , W/m
−2
273
281
124
124
95
R n , W/m
−2
445
517
771
730
830
R n /K*, %
62
65
86
85
90
T , °C
50.7
51.8
29.4
29.5
24.7
delta T
4.5
2.2
1.7
0.8
0.9
Beta index
−12.9
6.3
17.2
34.4
130.7
TRN,
kJ/m
−2
°C
168
406
788
1631
1549
Source: Modified from Luvall and Holbo (1989), Holbo and Luvall (1989), and Bishop et al. (2004).
Note: K* = net incoming solar radiation, L* = net long wave, R n = net radiation, R n /K* = percent of net
incoming solar radiation degraded into nonradiative processes.
50
THERMAL INFRARED REMOTE SENSING FOR ANALYSIS OF LANDSCAPE